PRINCETON, NJ -- Continuing to represent one of the largest shifts of public opinion in Gallup history, 87% of Americans now favor marriage between blacks and whites, up from 4% in 1958.

These data are from Gallup's Minority Rights and Relations poll, conducted June 13-July 5. The poll surveyed 4,373 Americans, including 1,010 non-Hispanic blacks.
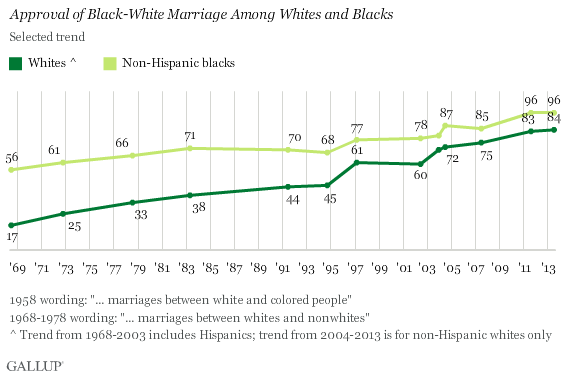
Approval of marriages between blacks and whites is up one percentage point from 2011, when this attitude was last measured. Approval has generally increased in a linear fashion from Gallup's first measure in 1958, reaching the majority threshold in 1997, and crossing the three-quarters line in 2004. Eleven percent of Americans today say they disapprove of black-white marriage, compared with 94% who disapproved in 1958.
Blacks' approval of black-white marriage (96%) is now nearly universal, while whites' approval is 12 percentage points lower, at 84%. Blacks' approval has consistently been higher than whites' over the decades, although attitudes among both racial groups have generally moved in a parallel manner since 1968 -- when Gallup first was able to report reliable estimates of each group's opinion. The gap between black approval and white approval in recent years has been smaller than it was prior to 1997.
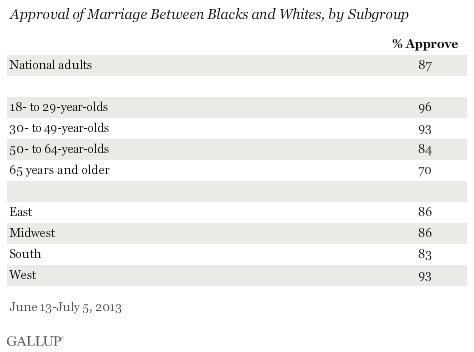
Older Americans Least Likely to Approve of Marriages Between Blacks and Whites
Approval of black-white marriage is higher among younger Americans, and lowest among those 65 and older. Americans living in the South are slightly below average in their approval, while approval is above average among those in the West. Similar patterns were evident in 2011.
Implications
Americans' attitudes about interracial marriage have changed dramatically over the past 55 years, moving from the point in the late 1950s when disapproval was well over 90%, to the point today when approval is approaching 90%. Census data indicate that black-white marriages in reality remain fairly rare -- although they have increased from 167,000 in 1980 to 558,000 in 2010, they still represent less than 1% of all married couples. The major shift in attitudes about such unions, however, is a telling indicator of the general shift in views of racial matters on many fronts in the U.S. over the last five decades.
Survey Methods
Results are based on telephone interviews conducted June 13-July 5, 2013 with 4,373 adults, aged 18 and older, living in all 50 U.S. states and the District of Columbia, including oversamples of black and Hispanic adults. All respondents had previously been interviewed in the Gallup Daily tracking survey. The total sample is weighted to represent racial and ethnic groups proportionately to their share of the U.S. population.
For results based on this sample of national adults, one can say with 95% confidence that the margin of error is ±2 percentage points.
For results based on sample of 2,149 non-Hispanic whites, the margin of sampling error is ±3 percentage points.
For results based on sample of 1,010 non-Hispanic blacks, the margin of sampling error is ±5 percentage points.
Interviews are conducted with respondents on landline telephones and cellular phones, with interviews conducted in Spanish for respondents who are primarily Spanish-speaking.
Samples are weighted to correct for unequal selection probability, non-response, and double coverage of landline and cell users in the two sampling frames. They are also weighted to match the national demographics of gender, age, race, Hispanic ethnicity, education, region, population density, and phone status (cell phone-only/landline only/both and cell phone mostly). Demographic weighting targets are based on the March 2012 Current Population Survey figures for the aged 18 and older U.S. population. Phone status targets are based on the July-December 2011 National Health Interview Survey. Population density targets are based on the 2010 census. All reported margins of sampling error include the computed design effects for weighting.
In addition to sampling error, question wording and practical difficulties in conducting surveys can introduce error or bias into the findings of public opinion polls.
View methodology, full question results, and trend data.
For more details on Gallup's polling methodology, visit www.gallup.com.