WASHINGTON, D.C. -- In the U.S., obesity in "food deserts" is above average. However, it is not solely -- or even primarily -- access to grocery stores that appears to be the issue -- higher obesity rates are more likely to be linked to lower incomes. In other words, a lack of access to food in and of itself doesn't matter when it comes to obesity, it only matters if Americans are also low-income. Further, income always matters, regardless of whether an individual has access to grocery stores or not.
"Food deserts" are typically defined as either an area that has limited access to grocery stores or as an area that is low-income and lacks access to grocery stores. Regardless of which definition is used, what is clear is that the lack of access to grocery stores alone is not related to higher obesity rates -- rather, it is more a lack of income.
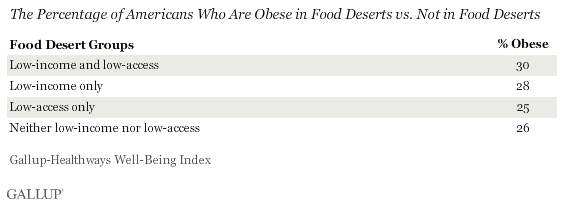
Americans living in areas that are both low-income and that have limited access to grocery stores are only marginally more likely than those living in areas that are low-income, but that don't lack access to grocery stores to be obese -- about three in 10 in each. But, those Americans living in areas that have limited access to grocery stores -- but are not low-income -- are less likely to be obese, at 25%, and about equally as likely to be obese as those living in an area that is neither low-income nor low-access.
This analysis combines food desert data from the U.S. Department of Agriculture's Food Access Research Atlas with obesity data from the Gallup-Healthways Well-Being Index, in a first-of-its-kind study.
The Food Access Research Atlas labels geographic areas -- known as census tracts -- as low-income, low-access, both, or neither based on income data from the 2006-2010 American Community Survey and access data from two different lists of the locations of supermarkets, supercenters, and large grocery stores in 2010. Gallup and Healthways collect obesity data down to the ZIP code level and used more than 300,000 interviews with Americans aged 18 and older from 2010, assigning Americans to the most appropriate census tract. See page two for further methodological details.
To further assess the connection between food deserts and obesity -- or lack thereof -- Gallup conducted an in-depth analysis of the factors most related to obesity. Gallup looked at a wide variety of factors: low-income and low-access to food (and the interaction between those two), gender, race/ethnicity, age, education, marital status, and region. The findings show that, while low-income alone is indeed a significant predictor of obesity, low-access alone is not. Low-income and low-access combined do have a significant relationship to obesity, though. But, the bottom line is that having a lower income is the dominant factor in an American's increased likelihood to be obese.
Implications
Two recent studies have called into question the popular theory of the connection between food deserts and obesity, but both studies only looked at children.
A 2012 study from the Public Policy Institute of California found that children in disadvantaged neighborhoods actually had greater access to supermarkets and grocery stores than those in better-off communities. The author, Helen Lee, concluded that "differential exposure to food outlets does not independently explain weight gain over time" for the group of school-aged children she studied.
Another 2012 study, by the RAND Corporation, similarly found no relationship between the food available where children lived and what they weighed. RAND used data on more than 13,000 California children aged five to 17 years from the 2005 and 2007 California Health Interview Survey.
These studies and Gallup's new analysis reveal that a focus on increasing access to places to buy healthy food alone may not be an answer to help improve how people in "food deserts" eat, nor a way to positively impact their health and weight. The data highlight that addressing food affordability -- and possibly even increasing knowledge about what constitutes healthy foods -- is more likely the answer to decreasing obesity in America's food deserts.
About the Gallup-Healthways Well-Being Index
The Gallup-Healthways Well-Being Index tracks well-being in the U.S. and provides best-in-class solutions for a healthier world. To learn more, please visit well-beingindex.com.
Survey Methods
Results are based on telephone interviews conducted as part of the Gallup-Healthways Well-Being Index survey Jan. 1-Dec. 31, 2010, with a random sample of 300,264 adults, aged 18 and older, living in all 50 U.S. states and the District of Columbia, selected using random-digit-dial sampling.
For results based on the total sample of national adults, one can say with 95% confidence that the maximum margin of sampling error is ±1 percentage point.
Interviews are conducted with respondents on landline telephones and cellular phones, with interviews conducted in Spanish for respondents who are primarily Spanish-speaking. Each daily sample includes a minimum quota of 150 cell phone respondents and 850 landline respondents, with additional minimum quotas among landline respondents for gender within region. Landline respondents are chosen at random within each household on the basis of which member had the most recent birthday.
Samples are weighted by gender, age, race, Hispanic ethnicity, education, region, adults in the household, cell phone-only status, cell phone-mostly status, and phone lines. Demographic weighting targets are based on the March 2009 Current Population Survey figures for the aged 18 and older non-institutionalized population living in U.S. telephone households. All reported margins of sampling error include the computed design effects for weighting and sample design.
In addition to sampling error, question wording and practical difficulties in conducting surveys can introduce error or bias into the findings of public opinion polls.
For more details on Gallup's polling methodology, visit www.gallup.com.
How Gallup defined and constructed the four groups analyzed: Using data from the U.S. Department of Agriculture's Food Access Research Atlas, Gallup created four groups:
- Low-income and low-access: Consists of Americans living in low-income census tracts that also have low access to healthy food, which is defined as being far from a supermarket, supercenter, or large grocery store ("supermarket" for short). A census tract is considered to have low access if a significant number or share of individuals in the tract is far from a supermarket. One mile was used in urban areas and 10 miles was used in rural areas to demarcate those who are far from a supermarket.
- Low-income: Consists of Americans living in low-income census tracts.
- Low-access: Consists of Americans living in census tracts that have low access to healthy food, which is defined as being far from a supermarket, supercenter, or large grocery store ("supermarket" for short). A census tract is considered to have low access if a significant number or share of individuals in the tract is far from a supermarket.
- Neither low-income nor low-access: Consists of Americans living in census tracts which are neither low-income nor low-access.
Detailed information about how the U.S. Department of Agriculture's Food Access Research Atlas determines which census tracts are low-income and low-access is available here.
How Gallup measured obesity among the four groups analyzed: Gallup and Healthways collect obesity data down to the ZIP code level, based on American adults' self-reported height and weight. This analysis is based on more than 300,000 interviews with Americans aged 18 and older from 2010.
How Gallup merged its obesity data with the U.S. Department of Agriculture's Food Access Research Atlas food desert data: Gallup merged together the U.S. Department of Agriculture's Food Access Research Atlas food desert data, which is organized into census tracts, with its obesity data, which is available at the ZIP code level. Gallup used a plurality method to assign its respondent-level obesity data to the most appropriate census tract. Doing so means Gallup could not perfectly match its respondents to exact census tracts, as there can be multiple census tracts within one ZIP code and census tracts can also cross different ZIP codes. However, this method creates a reliable estimate of which of Gallup's respondents belong in which census tract. Gallup excluded group quarter census tracts. These are college dormitories, correctional facilities, assisted living facilities, etc., where there aren't supermarkets but inhabitants are fed through dining halls and the like. Gallup felt it was inaccurate to call these locations food deserts due to the nature of the circumstances in which people are living.
