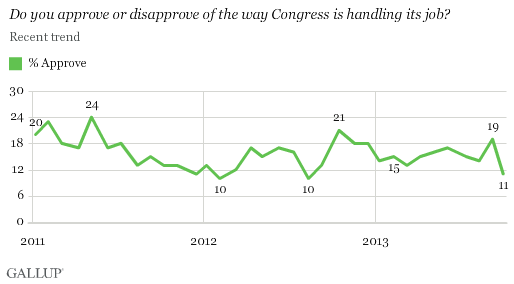
PRINCETON, NJ -- As Congress' inability to agree on compromises that would reopen the partially shut-down government and raise the looming debt ceiling continues, Americans give Congress an 11% job approval rating, down eight percentage points from last month and one point above the worst rating in Gallup history.
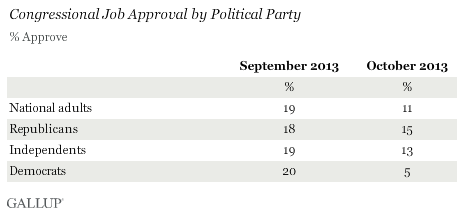
The drop in Congress' approval rating is fueled in large part by Democrats' declining approval of Congress -- from 20% in September to 5% in October. Approval ratings among Republicans and independents have also fallen, but by much smaller margins. The big drop in Democrats' approval of Congress most certainly reflects Democrats' negative views of the Republican-controlled House, in which leadership has publicly demanded that the president and Democrats in Congress agree to changes in the Affordable Care Act as a condition for passing a continuing resolution or a budget. Overall, however, approval of Congress is very low across all partisan groups.
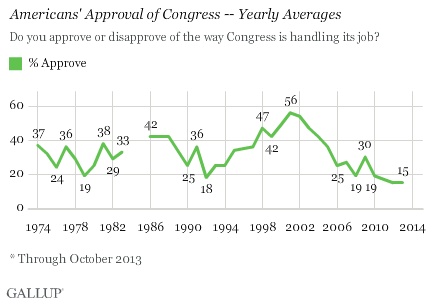
Americans' Approval of Congress Remains Historically Low
Americans' current approval of Congress is well below where it was in the broad time period surrounding the government shutdown in December 1995. Gallup did not measure Congress' job approval frequently in that era, but it was 30% in September 1995, prior to the shutdown, and 35% when Gallup next measured it in April 1996, after the shutdown.
Those readings in 1995 and 1996 were roughly at Gallup's overall historical average approval rating of 33%.
There has been a downward trend in Congress' job approval since 2010, with approval ratings in 2011 and 2012 each lower than the year before. Notably, approval dropped to as low as 13% in August, October, and November of 2011 during the previous threat of a default, and reached 11% in December of that year. Subsequently, approval fell to its all-time low of 10% in February and August of 2012.
Congress' job approval was trending slightly up from those depths most recently, averaging 15% from January through September of this year, with the 19% recorded last month the highest of the year -- only to fall dramatically in Gallup's latest Oct. 3-6 measure, taken after the partial government shutdown had begun.
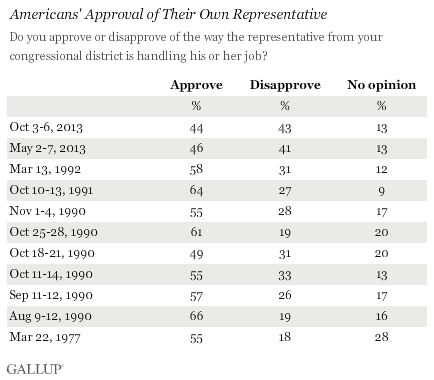
Amerians' Approval of Their Own Representative Averages 44%
While Congress as a whole gets dismal job approval ratings, Americans are significantly more charitable when it comes to the member of Congress representing their particular district. Americans now give their own representative a 44% approval rating, which is not an extremely high rating on an absolute basis, but is certainly high compared with Congress' overall 11% rating in the same survey.
Americans' ratings of their own representative is little changed from Gallup's last measurement in May, when 46% approved. However, fewer Americans approve and more disapprove of their own member of Congress than what Gallup has found in the past, and the percentages who approve and disapprove are now essentially equal. Typically, Americans have been much more likely to approve than disapprove of their own representative.
Implications
Members of Congress are no doubt aware that their work as a body receives extremely low marks from the American public -- now within one point of being the lowest approval rating in Gallup history. Members of Congress' concerns about the image of the institution in which they serve, however, may be allayed to some degree by the finding that many more Americans approve of their particular representative than approve of Congress more generally, which has typically been the case.
Unlike in the past, however, Americans are now about as likely to disapprove as to approve of their own representative. While members of Congress may continue to argue that problems with the image of the body as a whole is not their fault, and that they are doing nothing more than faithfully representing their particular constituents, it is clear that even their own constituents are less positive about the job they are doing than they were in the past.
Not only is Congress' overall approval rating near historic lows, but satisfaction with the way things are going in the country is now well below 20%. Additionally, economic confidence continues to plummet, and 70% of Americans say that the shutdown is a crisis or a major problem.
Survey Methods
Results for this Gallup poll are based on telephone interviews conducted Oct. 3-6, 2013, with a random sample of 1,028 adults, aged 18 and older, living in all 50 U.S. states and the District of Columbia.
For results based on the total sample of national adults, one can say with 95% confidence that the margin of sampling error is ±4 percentage points.
Interviews are conducted with respondents on landline telephones and cellular phones, with interviews conducted in Spanish for respondents who are primarily Spanish-speaking. Each sample of national adults includes a minimum quota of 50% cellphone respondents and 50% landline respondents, with additional minimum quotas by region. Landline and cell telephone numbers are selected using random-digit-dial methods. Landline respondents are chosen at random within each household on the basis of which member had the most recent birthday.
Samples are weighted to correct for unequal selection probability, nonresponse, and double coverage of landline and cell users in the two sampling frames. They are also weighted to match the national demographics of gender, age, race, Hispanic ethnicity, education, region, population density, and phone status (cellphone only/landline only/both, and cellphone mostly). Demographic weighting targets are based on the March 2012 Current Population Survey figures for the aged 18 and older U.S. population. Phone status targets are based on the July-December 2011 National Health Interview Survey. Population density targets are based on the 2010 census. All reported margins of sampling error include the computed design effects for weighting.
In addition to sampling error, question wording and practical difficulties in conducting surveys can introduce error or bias into the findings of public opinion polls.
View methodology, full question results, and trend data.
For more details on Gallup's polling methodology, visit www.gallup.com.