PRINCETON, NJ -- President Barack Obama averaged 45.8% job approval during his fifth year in office. That is down more than two percentage points from his fourth-year average, and slightly better than his career-low 44.4% in his third year.
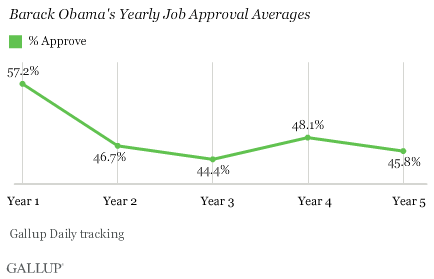
The results are based on more than 175,000 Gallup Daily tracking interviews conducted throughout Obama's fifth year in office, from Jan. 20, 2013 (also the start of his second term), through Jan. 19, 2014.
On the heels of his re-election victory, Obama's fifth year started off strongly, with consistent majority approval. However Americans' approval of Obama declined over the course of 2013. His latest Gallup Daily tracking job approval rating, based on Jan. 17-19 interviewing, is 40%, just two points above his personal low approval rating.
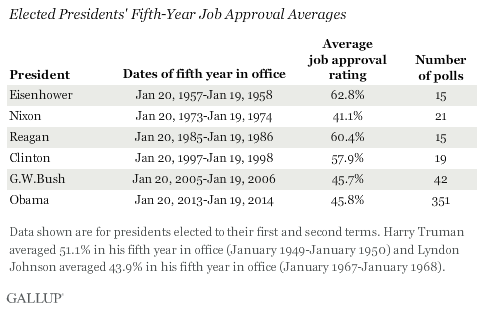
From a historical perspective, Obama's fifth-year approval average is in the lower range. It is similar to George W. Bush's 45.7%, but lower than those for Dwight Eisenhower, Ronald Reagan, and Bill Clinton. Obama's fifth-year average exceeds Richard Nixon's 41.1% in the year ending Jan. 19, 1974. Nixon's fifth-year approval rating reflected declining support as the Watergate scandal unfolded, but his fifth year ended well before he resigned from office.
Obama's Most Recent Quarter Nearly Matches His Worst
In the just-completed 20th quarter of Obama's presidency, from Oct. 20, 2013-Jan. 19, 2014, Obama averaged 41.2% job approval. That is slightly above his worst quarter, the 11th of his presidency, in which an average 41.0% of Americans approved of him.
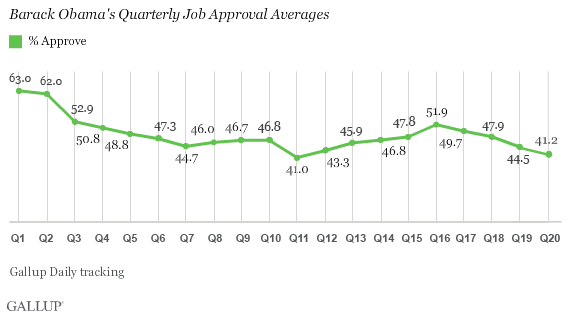
Obama's approval ratings dropped in every quarter of his fifth year in office, with the declines exceeding three points in each of the last two quarters. Prior to the recent four-quarter skid, Obama's average approval rating had improved for five quarters in a row.
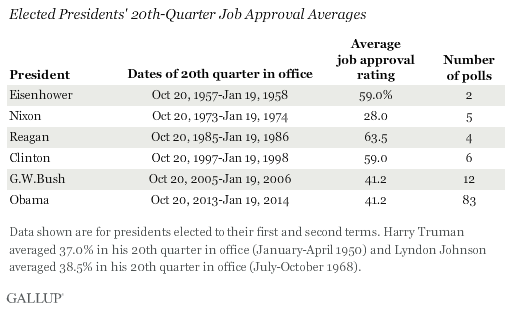
Obama's 20th-quarter average exactly matches that for George W. Bush in the same quarter. While Obama was struggling with the rollout of major provisions of the healthcare law, Bush was struggling with the response to Hurricane Katrina, opposition to his nomination of Harriet Miers to the Supreme Court, and the Iraq war. Nixon, however, had the lowest 20th-quarter average in Gallup's records, 28.0%, as the Watergate scandal intensified. Eisenhower, Clinton, and Reagan received approval averages at or near 60% at a similar point in their presidencies.
Implications
Obama's fifth year in office, which included the troubled rollout of his signature healthcare law and a government shutdown, was a difficult one. His approval ratings nosedived after re-election in a similar way to those of George W. Bush and, to a more extreme degree, Nixon, after they were re-elected. Neither of those two presidents recovered from that point on. Bush's quarterly ratings never averaged as high as 40% after his 20th quarter in office, and Nixon's held below 30% until he resigned from office. Both trends were attributable to unusual circumstances, however, with Nixon's second term plagued by scandal and Bush's by a protracted and unpopular war soon to be followed by an economic crisis.
There is no guarantee that Obama will suffer a similar fate. In the short term, however, all recent elected presidents except Clinton saw at least some decline in their 21st quarter in office, and only Clinton had a sixth-year approval average higher than his fifth-year average. From a historical perspective, then, the prospects for Obama's approval rating to improve are not great, although improvement would not be unprecedented.
Explore President Obama's approval ratings in depth and compare them with those of past presidents in the Gallup Presidential Job Approval Center.
Survey Methods
Results for this Gallup poll are based on telephone interviews conducted Oct. 20, 2013-Jan. 19, 2014, on the Gallup Daily tracking survey, with a random sample of 42,335 adults, aged 18 and older, living in all 50 U.S. states and the District of Columbia.
For results based on the total sample of national adults, the margin of sampling error is ±1 percentage point at the 95% confidence level.
Results for Barack Obama's fifth year in office are based on telephone interviews conducted Jan. 20, 2013-Jan. 19, 2014, on the Gallup Daily tracking survey, with a random sample of 179,032 adults. For results based on this sample, the margin of sampling error is ±1 percentage point at the 95% confidence level.
Interviews are conducted with respondents on landline telephones and cellular phones, with interviews conducted in Spanish for respondents who are primarily Spanish-speaking. Each sample of national adults includes a minimum quota of 50% cellphone respondents and 50% landline respondents, with additional minimum quotas by time zone within region. Landline and cellular telephone numbers are selected using random-digit-dial methods. Landline respondents are chosen at random within each household on the basis of which member had the most recent birthday.
Samples are weighted to correct for unequal selection probability, nonresponse, and double coverage of landline and cell users in the two sampling frames. They are also weighted to match the national demographics of gender, age, race, Hispanic ethnicity, education, region, population density, and phone status (cellphone only/landline only/both, cellphone mostly, and having an unlisted landline number). Demographic weighting targets are based on the most recent Current Population Survey figures for the aged 18 and older U.S. population. Phone status targets are based on the most recent National Health Interview Survey. Population density targets are based on the most recent U.S. census. All reported margins of sampling error include the computed design effects for weighting.
In addition to sampling error, question wording and practical difficulties in conducting surveys can introduce error or bias into the findings of public opinion polls.
For more details on Gallup's polling methodology, visit www.gallup.com.