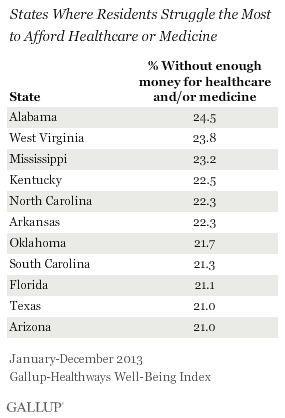
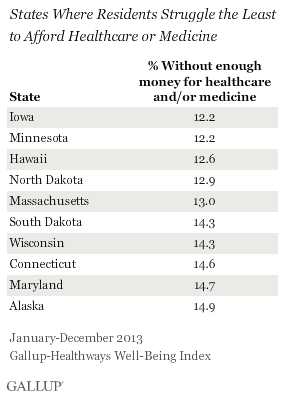
WASHINGTON, D.C. -- One in four Alabamans (24.5%) said in 2013 that there were times in the past 12 months when they did not have enough money to pay for the healthcare and/or medicine they and their families needed -- the highest percentage in the nation. Residents of West Virginia and Mississippi followed closely behind. At the other end, Iowa and Minnesota tied for the lowest percentage of residents who were unable to afford needed healthcare or medicine, at 12.2%.
These results are based on interviews conducted Jan. 2-Dec. 29, 2013, with more than 178,067 Americans in all 50 states and the District of Columbia as part of the Gallup-Healthways Well-Being Index.
 |
| Explore complete state data > |
Gallup asks Americans each day if there have been times over the past 12 months in which they did not have enough money to pay for healthcare and/or medicine they or their families needed. In 2013, 18.6% of Americans said they had trouble affording healthcare or medicine. The national average has held steady in recent years after a slight drop from the 19.7% average found in 2008.
In 2008, 24 states reported 20% or more of their residents said they could not afford needed healthcare. By 2013, this dropped to 16 states.
States with the highest percentages of residents who could not afford needed healthcare and/or medicine are predominantly in the South, where overall well-being scores lagged compared with the rest of the country. States where residents were least likely to struggle to afford these basic necessities are more geographically diverse.
Though it still falls among the bottom state rankings, Mississippi has seen the greatest improvement since 2008 in the percentage of residents who have trouble paying for healthcare or medicine. The percentage who struggled in Mississippi has steadily declined from 30.1% in 2008 to 23.2% in 2013.
Affording Healthcare Linked to Uninsured Rates
States with higher percentages of residents who struggled to afford healthcare or medicine also tend to have higher uninsured rates, lower ratings of the standard of living, or both. All 10 states with the highest percentage of residents who struggled to afford healthcare or medicine had uninsured rates that exceeded the national average of 17.3% in 2013, and most were among the list of states with the highest uninsured rates in 2013.
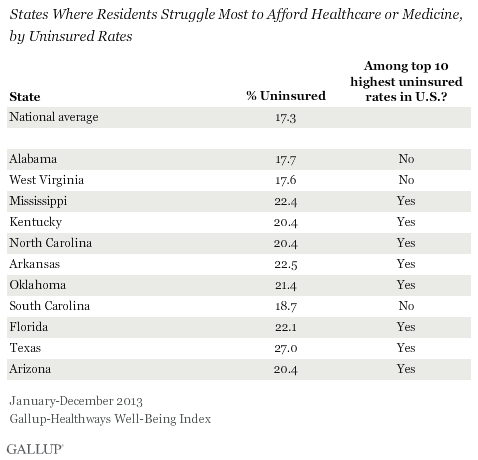
Lacking healthcare coverage, however, is not a perfect predictor of Americans' ability to afford needed healthcare in a given state. Though the uninsured rates in Alabama and West Virginia are above average, they were not among the top 10 states lacking insurance coverage. Still, they topped the list of states with high percentages of residents who struggled to afford healthcare or medicine in 2013. For these two states, their low standard of living ratings suggest that residents' financial struggles may play a role in their ability to pay for healthcare. Alabama and West Virginia also rank among the poorest states in the nation based on per capita income.
Bottom Line
The majority of Americans in all 50 states say there were no times in the past 12 months when they could not pay for healthcare or medicine. However, substantial numbers of Americans did struggle to pay these costs, including at least one in five residents in 16 states.
States with higher uninsured rates are clearly more at risk of having higher percentages of residents who cannot meet their healthcare needs. States are making decisions on how to navigate the Affordable Care Act's ongoing implementation. If states successfully reduce the number of residents without insurance, it may in turn help reduce the percentage who say they cannot afford what they need in terms of healthcare.
But insurance isn't the entire problem for many Americans -- it's their personal financial situation that hinders them from purchasing the medicine or care they need. This is a challenge for all states, as Americans' views of their personal finances fell and their future expectations for their finances remained stagnant in 2013. While insuring more Americans may be one part of helping residents to afford the healthcare and medicine they need, addressing the need for jobs and increasing median income may also be necessary.
Gallup's "State of the States" series reveals state-by-state differences on political, economic, and well-being measure Gallup tracks each day. New stories based on full-year 2013 data will be released in the coming months.
Survey Methods
Results are based on telephone interviews conducted as part of the Gallup-Healthways Well-Being Index survey Jan. 2-Dec. 29, 2013, with a random sample of 178,067 adults, aged 18 and older, living in all 50 U.S. states and the District of Columbia.
The margin of sampling error for most states is ±1 to ±2 percentage points, but is as high as ±4 points for states with smaller population sizes such as Wyoming, North Dakota, South Dakota, Delaware, and Hawaii.
Interviews are conducted with respondents on landline telephones and cellular phones, with interviews conducted in Spanish for respondents who are primarily Spanish-speaking. Each sample of national adults includes a minimum quota of 50% cellphone respondents and 50% landline respondents, with additional minimum quotas by region. Landline telephone numbers are chosen at random among listed telephone numbers. Cellphone numbers are selected using random-digit-dial methods. Landline respondents are chosen at random within each household on the basis of which member had the most recent birthday.
Samples are weighted to correct for unequal selection probability, nonresponse, and double coverage of landline and cell users in the two sampling frames. They are also weighted to match the national demographics of gender, age, race, Hispanic ethnicity, education, region, population density, and phone status (cellphone only/landline only/both, cellphone mostly, and having an unlisted landline number). Demographic weighting targets are based on the most recent Current Population Survey figures for the aged 18 and older U.S. population. Phone status targets are based on the most recent National Health Interview Survey. Population density targets are based on the most recent U.S. census. All reported margins of sampling error include the computed design effects for weighting.
In addition to sampling error, question wording and practical difficulties in conducting surveys can introduce error or bias into the findings of public opinion polls.
For more details on Gallup's polling methodology, visit www.gallup.com.