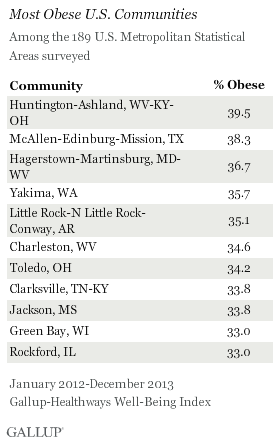
WASHINGTON, D.C. -- Boulder, Colo., continues to have the lowest obesity rate in the nation, at 12.4%. Boulder has had the lowest obesity rate nearly every year since Gallup and Healthways began measuring in 2008, with the exception of 2009. Residents of Huntington-Ashland, W.Va.-Ky.-Ohio, were the most likely to be obese in 2012-2013, at 39.5%.

Adult obesity rates are above 15% in all but one of the 189 metro areas that Gallup and Healthways surveyed in 2012 and 2013. The U.S. Department of Health and Human Services' Healthy People 2010 program had a goal of reducing obesity to 15% in each state. No state and only one U.S. metro area has achieved this goal.
Huntington-Ashland has been among the 10 most obese communities every year since 2008. The obesity rate for the most obese metro area in 2008 -- Binghamton, N.Y., at 34.6% -- is lower than the obesity rates found in five most obese cities from 2012-2013.
These data reflect the state level results for 2013, which found that Mississippi and West Virginia were the most obese states and Montana and Colorado were the least. Three areas in Colorado -- Boulder, Fort Collins-Loveland, and Denver-Aurora -- were among the communities with the 10 lowest obesity rates.
Nationwide, the U.S. obesity rate increased to 27.1% in 2013, the highest Gallup and Healthways have recorded since tracking began in 2008. Obesity rates have increased in many communities since 2011, including a 3.5-percentage-point uptick in Huntington-Ashland.
Gallup and Healthways track U.S. obesity levels as part of the Gallup-Healthways Well-Being Index, using Americans' self-reported height and weight to calculate Body Mass Index (BMI) scores. BMI scores of 30 or higher are considered obese.
Gallup interviewed at least 300 adults aged 18 and older in each of 189 MSAs. Each MSA sample is weighted to match the demographic characteristics of that area. Gallup categorizes U.S. metro areas according to the U.S. Office of Management and Budget's definitions for Metropolitan Statistical Areas (MSAs)
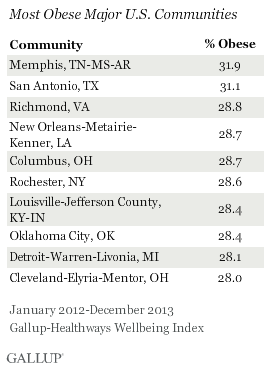
Memphis Is Most Obese Large Community
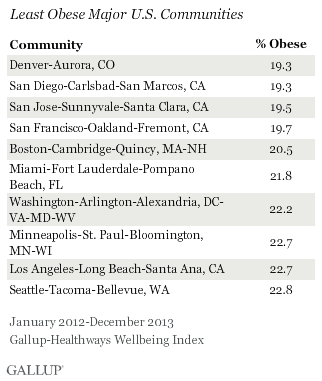
Among large communities with populations above 1 million, Memphis, Tenn.-Miss.-Ark., had the highest obesity rate, at 31.9%, while Denver-Aurora and San Diego-Carlsbad-San Marcos, Calif., tied for the lowest at 19.3%.
The average obesity rate for all large communities was 25.7%, almost two points below the national average. None of the large communities designated as having the highest obesity rates ranked among the communities of all sizes with the 10 highest obesity rates. These findings suggest that residents in smaller communities are more likely to be obese than those living in larger communities.
Implications
Not only is Colorado the state with the second-lowest obesity rate in the nation, but three of its metro areas -- Boulder, Fort Collins-Loveland, and Denver-Aurora -- are listed among the 10 communities with the lowest obesity rates. This may be because Colorado is known for its outdoor spaces and activities, which attracts active residents and encourages residents to live healthy lifestyles. Colorado has ranked among the top 10 states for frequent exercise every year since Gallup began tracking.
In two U.S. communities, Huntington-Ashland and McAllen-Edinburg-Mission, Texas, nearly two in five residents are obese. Nationally, obesity rates may be rising because of healthy eating habits worsening in 2013. Obesity is linked to lower worker productivity, which could negatively affect local and national economies
"Rising obesity rates have significant health consequences for both individuals and communities of all sizes. Numerous social, environmental, economic, and individual factors may all contribute to physical inactivity and consumption of less healthy foods, two lifestyle behaviors linked to obesity," says Janna Lacatell, Healthways Lifestyle Solutions Director. "In order to combat the trend and encourage individuals to make healthier choices, community-based policy and environmental approaches can, and should, be used."
Programs focused on making healthy eating habits and active lifestyles the easy choice for residents could do a lot to help lower obesity rates in communities across the country. With the national obesity rate at an all-time high, a focus on lowering obesity rates at the local level could be an effective way to reduce the obesity rate and its negative effects on the economy and individuals.
Survey Methods
Results are based on telephone interviews conducted as part of the Gallup-Healthways Well-Being Index survey Jan. 2-Dec. 29, 2012, and Jan. 2-Dec. 30, 2013, with a random sample of 531,630 adults, aged 18 and older, living in metropolitan areas in the 50 U.S. states and the District of Columbia, selected using random-digit-dial sampling. Two years of data were aggregated together to enable the same number of reportable cities as in prior years, when the overall annual data collection exceeded 350,000 interviews per year compared to 178,072 interviews conducted in 2013. At least 300 cases are required per metro area for reporting.
The metro areas referenced in this article are based on the Metropolitan Statistical Areas (MSAs) as defined by the U.S. Office of Management and Budget. In many cases, more than one city is included in the same MSA. The San Jose, Calif., metropolitan statistical area, for example, also includes the smaller nearby cities of Sunnyvale and Santa Clara in addition to San Jose itself. Each respondent is attributed to his or her MSA based on the self-report of his or her ZIP code, and all metro areas had at least 300 completed surveys in the 2012-2013 data collection period.
Maximum expected error ranges for the Well-Being Index and the sub-index scores vary according to MSA size, ranging from less than 1 point for the largest cities represented to ±1.5 points for the smallest cities.
Interviews are conducted with respondents on landline telephones and cellular phones, with interviews conducted in Spanish for respondents who are primarily Spanish-speaking. Each sample of national adults includes a minimum quota of 50% cellphone respondents and 50% landline respondents, with additional minimum quotas by time zone within region. Landline and cellular telephone numbers are selected using random-digit-dial methods. Landline respondents are chosen at random within each household on the basis of which member had the most recent birthday.
Samples are weighted to correct for unequal selection probability, nonresponse, and double coverage of landline and cell users in the two sampling frames. They are also weighted to match the national demographics of gender, age, race, Hispanic ethnicity, education, region, population density, and phone status (cellphone only/landline only/both, and cellphone mostly). Demographic weighting targets are based on the most recent Current Population Survey figures for the aged 18 and older U.S. population. Phone status targets are based on the most recent National Health Interview Survey. Population density targets are based on the most recent U.S. census. All reported margins of sampling error include the computed design effects for weighting.
In addition to sampling error, question wording and practical difficulties in conducting surveys can introduce error or bias into the findings of public opinion polls.
For more details on Gallup's polling methodology, visit www.gallup.com.
