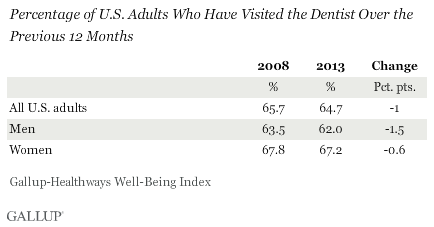
WASHINGTON, D.C. -- About one in three U.S. adults say they did not visit the dentist at some point in the past 12 months. The 64.7% in 2013 who said they did visit the dentist at least once in the previous year is essentially unchanged from the rate found in 2008. Women are more likely than men to report visiting the dentist annually.
These findings are based on interviews with 178,072 American adults conducted during 2013 and with 354,645 adults conducted during 2008 as part of the Gallup-Healthways Well-Being Index. Respondents were asked whether they had visited the dentist in the previous 12 months. Results for all years between 2008 and 2013 are similar.
The American Dental Association recommends that adults develop a plan for dental visits with their dentist, but say even those at low risk of oral disease benefit from at least annual cleanings. Thus, one in three American adults do not meet this minimum level of dental care.
Blacks, Hispanics, and Young Adults Least Likely to Visit Dentist
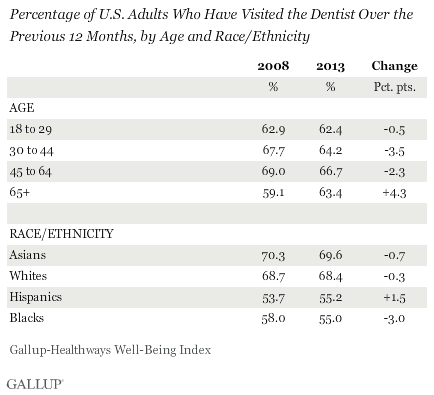
Among racial and ethnic groups, 55% of both blacks and Hispanics report visiting the dentist in the past year. Whites and Asians, in contrast, each are at about 70%, demonstrating that there is a notable racial and ethnic divide. Dental visit rates across most groups are similar to levels found in 2008, although there has been a small decline among blacks since that time.
In contrast, there are much smaller differences across age groups in reported dental behaviors. Young adults aged 18 to 29 are the least likely to have visited the dentist, but only marginally less so than those who are middle aged or older. An improved rate among seniors since 2008 is offset by a similarly sized decline among those 30 to 44.
Dental Habits Improve With Income
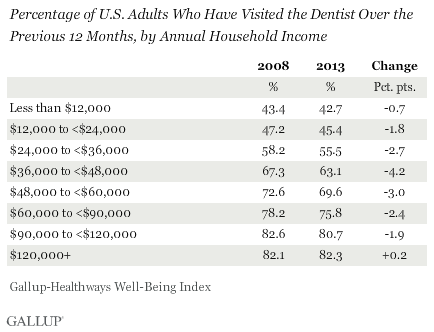
The most pronounced differences in dental habits are those across income groups. Those who earn $120,000 or more annually in household income are about twice as likely as those who earn less than $12,000 to say they visited the dentist in the past 12 months, 82.3% vs. 42.7%, respectively. Dental visit rates have held steady since 2008 for top earners, while they have declined for all other groups, particularly for low- and middle-income households with incomes between $24,000 and $60,000 per year.
Annual Dental Visits Least Common in the South
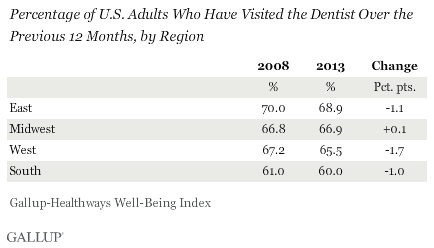
Dental visit rates are essentially unchanged in all regions compared with 2008. As was the case in 2008, 2013 rates are lowest in the South (60.0%) and highest in the East (68.9%).
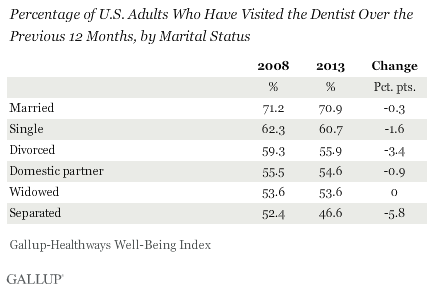
Married Adults Much More Likely Than Nonmarried to Visit Dentist
Marital status also influences dental decisions, with those who are married much more likely to report visiting the dentist annually than those who are not married. Those who are separated are the least likely to report visiting the dentist, and rates have dropped the most among this group -- nearly six percentage points -- since 2008.
Implications
Poor oral care can lead to many potential negative health outcomes. Recent medical research has indicated that when combined with other risk factors, poor oral health may be linked to both heart disease and stroke, possibly due to dislodged oral bacteria entering into the bloodstream. Maternal periodontal disease, too, has been linked to preterm births, and may increase risks for other diseases such as atherosclerosis, rheumatoid arthritis, and diabetes, among others.
The percentage of adults visiting a dentist in the past year varies widely across the major U.S. racial/ethnic boundaries, and may reflect several factors, including household income. Having health insurance coverage -- which is related to income -- also appears to be a meaningful factor in dental visits, although the Affordable Care Act may help minimize the disparities in professional dental care among income groups. According to the American Dental Association's Health Policy Resources Center, as many as 17 million adults could gain some form of dental coverage via the ACA over the next several years.
Regardless of income or insurance status, however, poor oral health is preventable. Health literacy, access, and motivation can all increase the likelihood of routine dental visits and help reduce the negative health outcomes associated with not visiting the dentist.
About the Gallup-Healthways Well-Being Index
The Gallup-Healthways Well-Being Index tracks well-being in the U.S. and provides best-in-class solutions for a healthier world. To learn more, please visit well-beingindex.com.
Survey Methods
Results are based on telephone interviews conducted as part of the Gallup-Healthways Well-Being Index survey Jan. 2-Dec. 29, 2013, with a random sample of 178,072 adults, and Jan. 2-Dec. 30, 2008, with a random sample of 354,645 adults, aged 18 and older, living in all 50 U.S. states and the District of Columbia.
For results based on the total sample of national adults, the margin of sampling error is ±1 percentage point at the 95% confidence level.
The margin of sampling error for most demographic groups is less than ±1 percentage point, but is as high as ±2 points for groups with smaller populations, such Asians or those who are separated from their spouse.
Interviews are conducted with respondents on landline telephones and cellular phones, with interviews conducted in Spanish for respondents who are primarily Spanish-speaking. Each sample of national adults includes a minimum quota of 50% cellphone respondents and 50% landline respondents, with additional minimum quotas by time zone within region. Landline and cellular telephone numbers are selected using random-digit-dial methods. Landline respondents are chosen at random within each household on the basis of which member had the most recent birthday.
Samples are weighted to correct for unequal selection probability, nonresponse, and double coverage of landline and cell users in the two sampling frames. They are also weighted to match the national demographics of gender, age, race, Hispanic ethnicity, education, region, population density, and phone status (cellphone only/landline only/both, and cellphone mostly). Demographic weighting targets are based on the most recent Current Population Survey figures for the aged 18 and older U.S. population. Phone status targets are based on the most recent National Health Interview Survey. Population density targets are based on the most recent U.S. census. All reported margins of sampling error include the computed design effects for weighting.
In addition to sampling error, question wording and practical difficulties in conducting surveys can introduce error or bias into the findings of public opinion polls.
For more details on Gallup's polling methodology, visit www.gallup.com.