WASHINGTON, D.C. -- The uninsured rate for U.S. adults in April was 13.4%, down from 15.0% in March. This is the lowest monthly uninsured rate recorded since Gallup and Healthways began tracking it in January 2008, besting the previous low of 13.9% in September of that year.
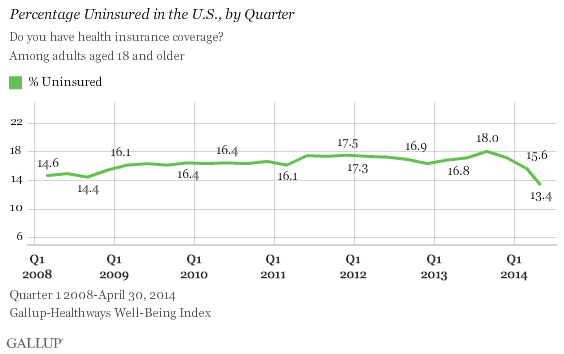
The uninsured rate peaked at 18.0% in the third quarter of 2013, but has consistently declined since then. This downward trend in the uninsured rate coincided with the health insurance marketplace exchanges opening in October 2013, and accelerated as the March 31 deadline to purchase health insurance coverage approached -- and passed -- for most uninsured Americans. The Obama administration decided in late March to extend the deadline to April 15 for those who had already begun the enrollment process.
The uninsured rates for the first quarter of 2014 and the month of March are averages for the entire quarter and month, and do not necessarily reflect the uninsured rate for the day of the March 31 deadline. The April estimate better captures the impact of late sign-ups since all interviewing occurred after that critical date.
These data are based on more than 14,700 interviews with Americans from April 1-30, 2014, as part of the Gallup-Healthways Well-Being Index.
Uninsured Rate Falls Most Among Blacks, Hispanics, Lower-Income Americans
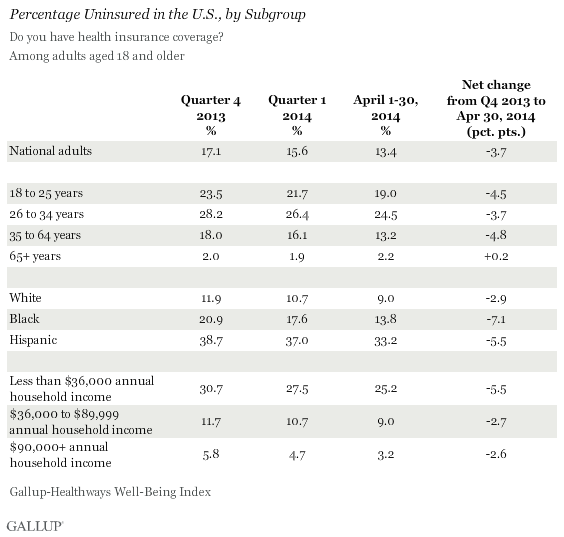
The uninsured rate was lower in April than in the fourth quarter of 2013 across nearly every key demographic group. The rate dropped more among blacks than any other demographic group, falling 7.1 percentage points to 13.8%. Hispanics were expected to disproportionately benefit from the Affordable Care Act -- commonly referred to as "Obamacare" -- because they are the subgroup with the highest uninsured rate. Although the percentage of uninsured Hispanics, at 33.2%, is down 5.5 points since the end of 2013, this rate is still the highest by far across key demographic groups.
Similarly, the uninsured rate among lower-income Americans -- those with an annual household income of less than $36,000 -- has also dropped by 5.5 points, to 25.2%, since the fourth quarter of 2013.
Young Americans were an important target in public outreach efforts for enrollment because they can potentially subsidize the cost of insurance for those who are older and presumably less healthy. The uninsured rate among 18- to 25-year-olds fell 4.5 points, to 19.0%, from the fourth quarter of 2013. However, the uninsured rate declined even more among 35- to 64-year-olds, falling 4.8 points to 13.2%. The uninsured rate among 26- to 34-year-olds continued to decline, but at a rate more similar to the national average. These data do not show a disproportionately high rate of decline among younger Americans.
Implications
The uninsured rate was 2.2 points lower in April than in the first quarter of 2014, reflecting the surge in late health insurance sign-ups to meet the official March 31 deadline. This figure represents the average percentage of adults without health insurance since provisions established under the Affordable Care Act requiring Americans to have insurance went into effect on Jan. 1 of this year.
Several factors may determine whether the uninsured rate declines, ticks up, or levels off in the coming months. Factors that may push the uninsured rate down include more states choosing to expand Medicaid and more Americans electing to buy insurance as penalty amounts increase. Gallup research shows that the uninsured rate, on average, has dropped more in states that have elected to expand Medicaid and run their own healthcare exchanges than in states that have not. Gallup also has found that higher fines would prompt more Americans to sign up for health insurance.
On the other hand, it is likely that some newly insured Americans will not pay their premiums and will rejoin the ranks of the uninsured. It is also possible that the uninsured rate could hold steady until early 2015, when those currently without insurance sign up for policies going into effect at the beginning of next year.
Additionally, other provisions of the healthcare law have not yet gone into effect, such as the requirement for employers to provide health insurance to their employees by 2015. These provisions also may affect the uninsured rate over time.
Survey Methods
Results are based on telephone interviews conducted as part of the Gallup-Healthways Well-Being Index survey, April 1-30, 2014, with a random sample of 14,704 adults, aged 18 and older, living in all 50 U.S. states and the District of Columbia.
For results based on the total sample of national adults, the margin of sampling error is ±1 percentage point at the 95% confidence level.
Interviews are conducted with respondents on landline telephones and cellular phones, with interviews conducted in Spanish for respondents who are primarily Spanish-speaking. Each sample of national adults includes a minimum quota of 50% cellphone respondents and 50% landline respondents, with additional minimum quotas by time zone within region. Landline and cellular telephone numbers are selected using random-digit-dial methods. Landline respondents are chosen at random within each household on the basis of which member had the most recent birthday.
Samples are weighted to correct for unequal selection probability, nonresponse, and double coverage of landline and cell users in the two sampling frames. They are also weighted to match the national demographics of gender, age, race, Hispanic ethnicity, education, region, population density, and phone status (cellphone only/landline only/both, and cellphone mostly). Demographic weighting targets are based on the most recent Current Population Survey figures for the aged 18 and older U.S. population. Phone status targets are based on the most recent National Health Interview Survey. Population density targets are based on the most recent U.S. census. All reported margins of sampling error include the computed design effects for weighting.
In addition to sampling error, question wording and practical difficulties in conducting surveys can introduce error or bias into the findings of public opinion polls.
For more details on Gallup's polling methodology, visit www.gallup.com.