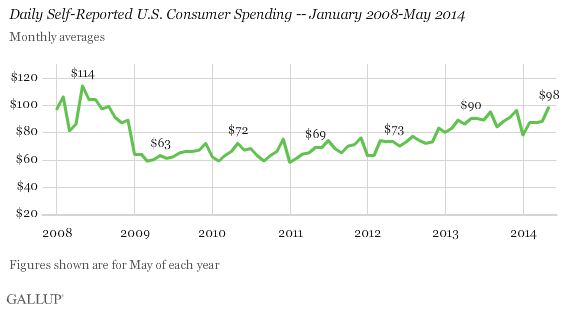
WASHINGTON, D.C. -- Americans' reports of daily spending spiked in May, averaging a six-year high of $98 -- $10 higher than the April average. This is also up from May 2013 ($90), and is the best figure for the month of May since 2008.
These figures are based on Americans' self-reports of the total amount they spent "yesterday" in stores, gas stations, restaurants, or online -- not counting home and vehicle purchases, or normal monthly bills.
The May spending estimate comes as good news for the economy, in which Americans' confidence has been largely stagnant so far in 2014. Spending estimates in May have generally climbed each year since May 2009's $63 average. Before this year, the highest May average since 2008 was last year's $90.
In the previous five years, April-to-May gains in consumer spending were moderate and predictable, ranging from $3 to $6. The exception was 2012, which saw no increase. Thus, the $10 spike in average daily spending between April and May this year is the largest between those two months since 2008, when spending jumped $28.
Three-Day Spending Average Highest Since 2008
One reason average spending in May was so high is the extraordinarily high spending levels seen around Memorial Day. The three-day spending average for May 27-29 reached $134 -- the highest three-day average since 2008. The three-day average closest to this figure was $129, during the pre-Christmas days of Dec. 21-23, 2013.
Bottom Line
Though Americans' views of the economy on a monthly basis have been flat throughout 2014, the May increase in spending suggests the possibility of some economic improvement. The six-year-high spending average last month is an indicator that regardless of whether Americans are feeling more confident about the economy, their personal cash flows have picked up.
Where spending levels go in June is something to watch. In previous years, May to June spending has either fallen slightly or remained flat.
Survey Methods
Results for this Gallup poll are based on telephone interviews conducted May 1-31, 2014, on the Gallup Daily tracking survey, with a random sample of 15,724 adults, aged 18 and older, living in all 50 U.S. states and the District of Columbia.
For results based on the total sample of national adults, the margin of sampling error is ±1 percentage point at the 95% confidence level. The margin of error for the spending mean is ±$5.
Interviews are conducted with respondents on landline telephones and cellular phones, with interviews conducted in Spanish for respondents who are primarily Spanish-speaking. Each sample of national adults includes a minimum quota of 50% cellphone respondents and 50% landline respondents, with additional minimum quotas by time zone within region. Landline and cellular telephone numbers are selected using random-digit-dial methods. Landline respondents are chosen at random within each household on the basis of which member had the most recent birthday.
Samples are weighted to correct for unequal selection probability, nonresponse, and double coverage of landline and cell users in the two sampling frames. They are also weighted to match the national demographics of gender, age, race, Hispanic ethnicity, education, region, population density, and phone status (cellphone only/landline only/both, and cellphone mostly). Demographic weighting targets are based on the most recent Current Population Survey figures for the aged 18 and older U.S. population. Phone status targets are based on the most recent National Health Interview Survey. Population density targets are based on the most recent U.S. census. All reported margins of sampling error include the computed design effects for weighting.
In addition to sampling error, question wording and practical difficulties in conducting surveys can introduce error or bias into the findings of public opinion polls.
For more details on Gallup's polling methodology, visit www.gallup.com.
