This article is part of an ongoing series exploring in-depth trends in Americans' consumer spending habits.
PRINCETON, NJ -- Slightly less than half of all Americans (45%) report spending more than they did a year ago, while 18% report spending less. A closer look at these numbers reveals Americans' increased spending is on household essentials, such as groceries, gasoline, utilities, and healthcare, rather than on discretionary purchases.
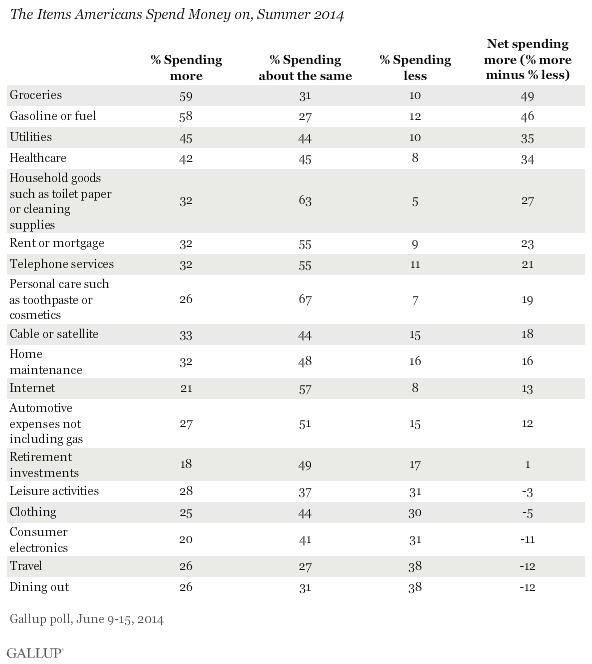
At the other end of the spectrum, roughly one-third of Americans report spending less on discretionary items such as travel (38%), dining out (38%), leisure activities (31%), consumer electronics (31%), and clothing (30%). More than half of Americans say they are spending about the same for rent or mortgage, household goods, telephone, automobile expenses other than fuel, personal care products, and the Internet.
All of this suggests that the increasing cost of essential items is further constraining family budgets already hit hard by the Great Recession and still reeling from a stagnant economy. This is the first time Gallup has measured household spending in this way, so it is unclear whether the current patterns are typical, or if the results on discretionary spending are better now than during the recession. Gallup's daily measure of consumer spending has been significantly higher the last two years than in 2009 through 2011 -- although this could be partly the result of higher spending on essentials.
Americans Traveling More This Summer, Especially Since Recession
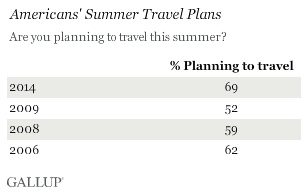
Americans' summer travel plans clearly demonstrate the tension between increased spending on essentials and reduced spending on discretionary items. While substantially more Americans say they are traveling this summer (69%) than said so in 2009 during the Great Recession (52%), over one-third of travelers plan to travel less (36%) than last year. This is roughly comparable to Gallup's findings in the summers of 2010 and 2011 (33% and 35%, respectively).
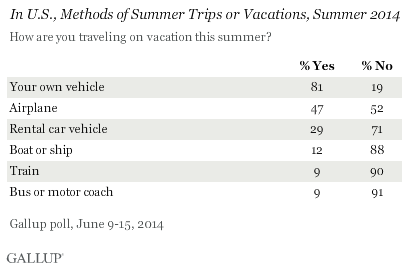
Also, many travelers plan to stay close to home: More than two-thirds of those traveling this summer intend to take a trip longer than an overnight trip. Among those, most will travel by car (81%), whereas slightly less than half will take at least one trip by air (47%). Less than 10% intend to travel by bus or train this summer. Slightly more than half expect both transportation and non-transport expenses for their summer trips to cost more this year than last.
Implications
These results paint a picture of consumers straining against rising prices on daily essentials to afford summer travel, dining out, and discretionary household purchases -- the kinds of purchases that ordinarily keep an economy humming. And while the two-thirds of Americans who plan to travel this summer is the highest level Gallup has measured since 2006, nearly one-third plan to spend just one night or less away from home, meaning it is not much of a vacation.
Those who do intend to travel this summer expect to spend more in all travel categories -- transportation, food, lodging, and entertainment -- than last year, further pressuring their already-strained budgets. Most will take their own cars despite relatively high gas prices. If there was any doubt that the U.S. economy is still struggling to get back on its feet, the results of this poll reinforce that reality. Because consumer spending is the lifeblood of a healthy economy, these findings suggest that discretionary spending still has a ways to go before it will fuel the kind of economic growth Americans have been hoping for.
Survey Methods
Results for this Gallup poll are based on telephone interviews conducted June 9-15, 2014, on the Gallup Daily tracking survey, with a random sample of 1,029 adults, aged 18 and older, living in all 50 U.S. states and the District of Columbia.
For results based on the total sample of national adults, the margin of sampling error is ±4 percentage points at the 95% confidence level.
Interviews are conducted with respondents on landline telephones and cellular phones. Interviews were conducted in English and Spanish. Each sample of national adults includes a minimum quota of 50% cellphone respondents and 50% landline respondents, with additional minimum quotas by time zone within region. Landline and cellular telephone numbers are selected using random-digit-dial methods. Landline respondents are chosen at random within each household on the basis of which member had the most recent birthday.
Samples are weighted to correct for unequal selection probability, nonresponse, and double coverage of landline and cell users in the two sampling frames. They are also weighted to match the national demographics of gender, age, race, Hispanic ethnicity, education, region, population density, and phone status (cellphone only/landline only/both, and cellphone mostly).
Demographic weighting targets are based on the most recent Current Population Survey figures for the aged 18 and older U.S. population. Phone status targets are based on the most recent National Health Interview Survey. Population density targets are based on the most recent U.S. census. All reported margins of sampling error include the computed design effects for weighting.
In addition to sampling error, question wording and practical difficulties in conducting surveys can introduce error or bias into the findings of public opinion polls.
For more details on Gallup's polling methodology, visit www.gallup.com.