WASHINGTON, D.C. -- Gallup's U.S. Economic Confidence Index dropped six points last week to -21 -- the largest one-week drop since last October, and the lowest weekly index score since December. Americans' confidence in the economy's future waned more than their views of the current conditions.
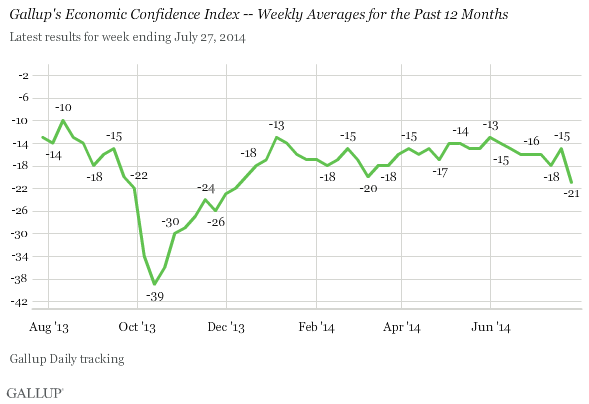
The last time the index fell below -20 was in December 2013, when it registered at -22 after recovering from the -39 reached during the partial government shutdown in October. The index has not dropped so sharply within a single week since falling 12 points amid the shutdown.
One-week changes of six points or more in the index have not been common in the six-plus years that Gallup has measured economic confidence in its Daily tracking survey. Last week's drop is especially notable considering that weekly averages have ranged narrowly between -13 and -20 this year, and have not fluctuated by more than three points between any two weeks this year.
Americans' Confidence in Economy's Outlook Plummets
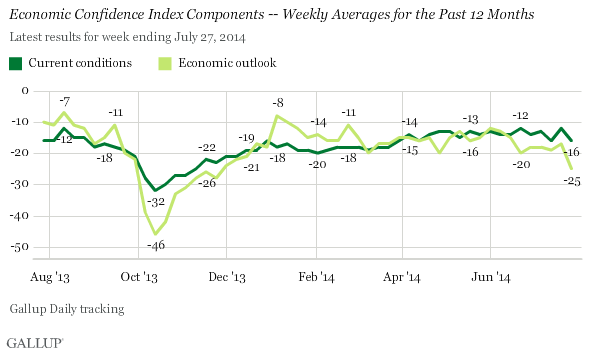
Gallup's Economic Confidence Index is the average of two components: Americans' views on the current economic situation and their perceptions of whether the economy is getting better or worse. Last week, 19% of Americans said the economy is "excellent" or "good," while 35% said it is "poor," resulting in a current conditions score of -16 -- a four-point dip from the previous week.
Americans' views on the economy's future were even more dismal and dramatic in their shift. While 35% of Americans said the economy is getting better, 60% said it is getting worse, resulting in an economic outlook score of -25. This is a drop of eight points from the previous week, and an eight-month low for the economic outlook measure.
Bottom Line
Last week's Economic Confidence Index reading is a notable departure from the previous week, in which confidence had improved by three points.
This drop is largely attributable to the low confidence Americans have in the economy's future, and not so much their views of its current health. The downturn coincides with a poor week for the stock market. The stock market drop could reflect nervousness about international tensions in the Middle East, a strained relationship between the U.S. and Russia, or the ongoing debate over immigration as children continue to cross the border in large numbers. It also might reflect poorer-than-expected earnings reports from major companies such as Amazon and Visa, which may signal weaker earnings in the second half of 2014 than previously thought.
Gallup.com reports results from these indexes in daily, weekly, and monthly averages and in Gallup.com stories. Complete trend data are always available to view and export in the following charts:
Daily: Employment, Economic Confidence and Job Creation, Consumer Spending
Weekly: Employment, Economic Confidence, Job Creation, Consumer Spending
Read more about Gallup's economic measures.
View our economic release schedule.
Survey Methods
Results for this Gallup poll are based on telephone interviews conducted July 21-27, 2014, on the Gallup Daily tracking survey, with a random sample of 3,548 adults, aged 18 and older, living in all 50 U.S. states and the District of Columbia.
For results based on the total sample of national adults, the margin of sampling error is ±2 percentage points at the 95% confidence level.
Interviews are conducted with respondents on landline telephones and cellular phones, with interviews conducted in Spanish for respondents who are primarily Spanish-speaking. Each sample of national adults includes a minimum quota of 50% cellphone respondents and 50% landline respondents, with additional minimum quotas by time zone within region. Landline and cellular telephone numbers are selected using random-digit-dial methods. Landline respondents are chosen at random within each household on the basis of which member had the most recent birthday.
Samples are weighted to correct for unequal selection probability, nonresponse, and double coverage of landline and cell users in the two sampling frames. They are also weighted to match the national demographics of gender, age, race, Hispanic ethnicity, education, region, population density, and phone status (cellphone only/landline only/both, and cellphone mostly). Demographic weighting targets are based on the most recent Current Population Survey figures for the aged 18 and older U.S. population. Phone status targets are based on the most recent National Health Interview Survey. Population density targets are based on the most recent U.S. census. All reported margins of sampling error include the computed design effects for weighting.
In addition to sampling error, question wording and practical difficulties in conducting surveys can introduce error or bias into the findings of public opinion polls.
For more details on Gallup's polling methodology, visit www.gallup.com.
