PRINCETON, NJ -- Registered voters are more likely to view their choice of candidate in this year's midterm elections as a message of opposition (32%) rather than support (20%) for President Barack Obama. That 12-percentage-point margin is similar to what Gallup measured for Obama in 2010 and George W. Bush in 2006, years in which their parties performed poorly in the midterm elections.
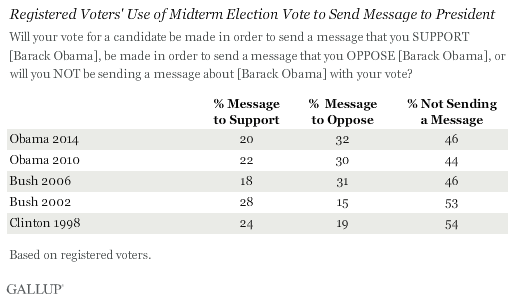
Gallup first asked this question in 1998, the year Republicans were moving toward impeaching President Bill Clinton for lying about his affair with a White House intern. That year, when Clinton's approval rating was 63%, more voters said their choice of candidate in the fall election would be made to show support rather than opposition to Clinton. Democrats had a strong showing in that fall's elections, gaining seats in the House of Representatives, bucking the historical pattern by which the president's party loses seats in Congress in midterm elections.
In the next midterm election, voters by an even larger margin said their vote would be made to support rather than oppose President George W. Bush, who had a 66% approval rating at the time of the elections. These attitudes were consistent with the eventual outcome, as Republicans increased their majority in the House and gained majority control of the Senate.
The presidents in the next two midterm elections were not popular, including Bush's second midterm election in 2006 (38%) when Democrats won control of the House and Senate and Obama's first midterm in 2010 (44%) when Republicans won back control of the House. Reinforcing that the 2014 midterms look more like 2006 and 2010 than 1998 or 2002, Obama's approval ratings have been in the low 40% range, including 42% in the most recent Gallup Daily tracking three-day rolling average.
Republican Opposition to Obama Overshadows Democrats' Support
A majority of Republican registered voters, 58%, say they will be sending a message of opposition to Obama with their vote this fall. In contrast, 38% of Democratic voters say they will support the president. Rather than supporting Obama, most Democrats, 53%, say they will not be sending a message with their vote.
Democrats are a bit less likely now (38%) than in 2010 (45%) to say they will be sending a message of support to Obama, while Republican opposition to the president is the same.
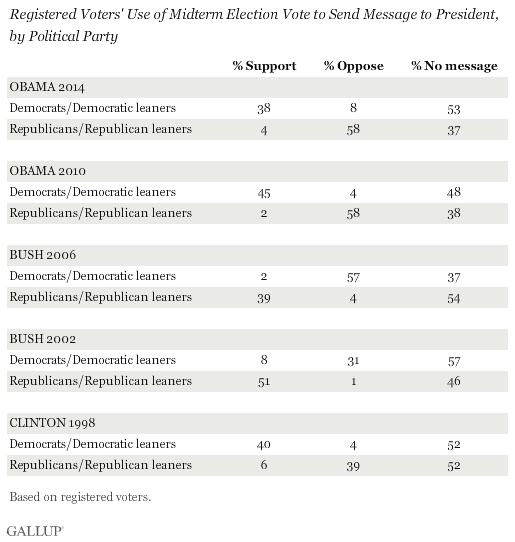
Obama's current numbers by party mirror Bush's numbers in his second midterm in 2006. A majority of Democrats at that time said they were voting to oppose Bush, and Republicans were more likely to say they were not sending a message with their vote than to say they were casting it to show support for Bush. The 2006 Bush numbers represented a shift from 2002 when most Republicans said they were voting to support Bush.
Implications
The president is always a major factor in midterm elections, with his party typically losing seats in Congress. And it is clear, based on his lower approval ratings and that more voters say they will be voting as a means of showing opposition rather than support for the president, that Obama is more of a liability than an asset to Democratic candidates this year. Republican operatives are aware of this, trying to link Democratic candidates to the president, particularly in key senate races that will determine whether the Democrats or Republicans hold the majority in the Senate next year. Contrary to Bush's active campaigning on behalf of Republicans in fall 2002, Obama himself may choose to be less active in campaigning for Democrats to avoid hurting Democratic candidates' chances.
Survey Methods
Results for this Gallup poll are based on telephone interviews conducted Sept. 25-30, 2014, with a random sample of 1,095 registered voters, aged 18 and older, living in all 50 U.S. states and the District of Columbia.
For results based on the total sample of registered voters, the margin of sampling error is ±4 percentage points at the 95% confidence level.
Interviews are conducted with respondents on landline telephones and cellular phones, with interviews conducted in Spanish for respondents who are primarily Spanish-speaking. Each sample of national adults includes a minimum quota of 50% cellphone respondents and 50% landline respondents, with additional minimum quotas by time zone within region. Landline and cellular telephone numbers are selected using random-digit-dial methods. Landline respondents are chosen at random within each household on the basis of which member had the most recent birthday.
Samples are weighted to correct for unequal selection probability, nonresponse, and double coverage of landline and cell users in the two sampling frames. They are also weighted to match the national demographics of gender, age, race, Hispanic ethnicity, education, region, population density, and phone status (cellphone only/landline only/both, and cellphone mostly). Demographic weighting targets are based on the most recent Current Population Survey figures for the aged 18 and older U.S. population. Phone status targets are based on the most recent National Health Interview Survey. Population density targets are based on the most recent U.S. census. All reported margins of sampling error include the computed design effects for weighting.
In addition to sampling error, question wording and practical difficulties in conducting surveys can introduce error or bias into the findings of public opinion polls.
View survey methodology, complete question responses, and trends.
For more details on Gallup's polling methodology, visit www.gallup.com.