GALLUP NEWS SERVICE
PRINCETON, NJ -- The second wave of the women's movement, which surged onto the public agenda in the early 1970s, was stimulated in part by controversy over the proper role of women and men at home and at work. Should women be allowed to work outside the home as the principal breadwinners? Should men be allowed to stay at home as the principal caretakers?
The latest Gallup Poll shows that if they were free to choose, a majority of women would opt for the traditional female role of staying at home, while a larger majority of men would prefer the traditional male role of working outside the home. But over the years, there has been a sea change in attitudes on this subject.
In 1938, a Gallup Poll asked Americans if they approved or disapproved of a married woman earning money in business or industry if her husband was capable of supporting her. More than three in four -- 78% -- said they disapproved; just 22% approved. Men and women expressed about the same level of disapproval. For most Americans of that time, it was the husband's responsibility to be the provider, the wife's responsibility to be the nurturer.
But these views changed, as more and more women took paying jobs, and many women who did not work outside the home became frustrated with the roles they were expected to play. By 1970, about a third of women were already working outside the home, and another quarter wished they could. Four years later, a Roper poll showed that 36% of women said they "would prefer to have a job outside of the home," while 60% would rather "stay home to take care of the house and family."
That decisive majority view in favor of the traditional role of women disappeared in Roper's 1978 poll, when slightly more women opted for working outside the home, by 49% to 45%.
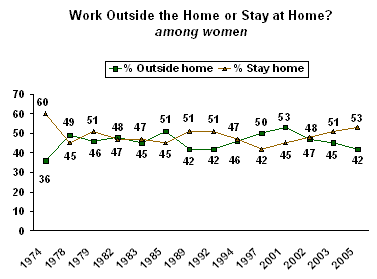
Since then, no clear consensus in either direction has emerged, with small majorities of women sometimes opting for working outside the home and, as measured in the latest Gallup survey, small majorities sometimes favoring the traditional role of family caretaker. These variations are mostly within the respective polls' margins of error, suggesting a mostly divided opinion among women.
Still, the recent figures from 2001 to the present show women moving in the direction of preferring the more traditional role. Four years ago, a majority of women favored working outside the home by 53% to 45%, while today a majority favors staying at home by 53% to 42%.
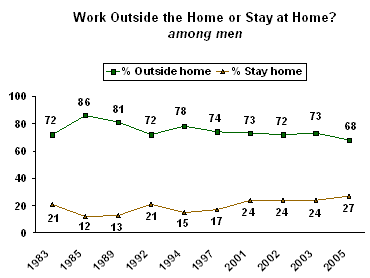
The first measurement of men's attitudes on this question came in 1983, with 72% of men preferring to work outside the home and just 21% preferring to stay at home. Two years later, the margin in favor of working was even larger, 86% to 12%. Since then, there has been a slow movement toward men staying at home, with the strongest support for that position recorded in the current poll -- but still more than 2-to-1 favor work, 68% to 27%.
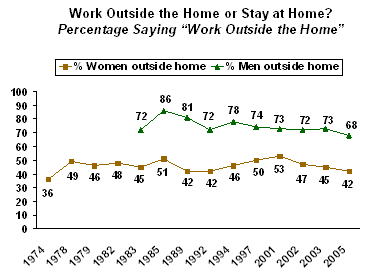
A comparison of men's and women's attitudes on working outside the home shows a persistently large gender gap over the years, at 27 points in 1983, and at 26 points today. During this period, the gap expanded to its largest size of 39 points in 1989, and shrank to its smallest size of 20 points in 2001.
A suggestion of what the future might hold can be seen in a comparison of attitudes by age. Fewer men under age 50 want to work outside the home than men 50 and older, with 65% and 72%, respectively, expressing that view. These results suggest that in the long run, more men may be opting for the nontraditional role of being family caretaker. The difference is small, however, and needs to be treated cautiously.
Among women, there is little difference in attitudes by age. If anything, younger women are slightly less likely to choose working outside the home (40%) than are older women (43%). The difference is well within the poll's margin of error, but the results indicate at least that younger women are not moving in a nontraditional direction more than older women.
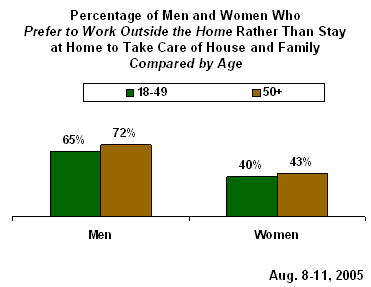
A similar comparison of attitudes measured in 2001 shows startling differences. In that survey, younger women were more likely than older women to prefer working outside the home, 56% vs. 48%. Overall, 53% of women preferred that option, compared with 42% in the current poll.
These results show that over the past four years, younger women -- much more than older women -- have turned away from working outside the home. Today, only 40% of younger women choose that option, compared with 56% of younger women in 2001 -- a 16-point decline. Among older women, the decline is more modest -- from 48% four years ago to 43% today.
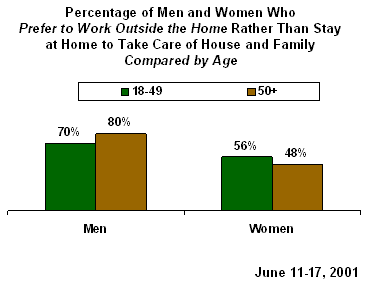
Among men, the changes in each age group tend to reinforce the overall and gradual movement toward staying at home. Today, 65% of younger men want to work outside the home, compared with 70% four years ago. Among older men, 72% want to work, down from 80% in 2001.
Survey Methods
Current results are based on telephone interviews with 1,001 national adults, aged 18 and older, conducted Aug. 8-11, 2005. For results based on the total sample of national adults, one can say with 95% confidence that the maximum margin of sampling error is ±3 percentage points.
For results based on the separate samples of 483 males and 518 females, the maximum margins of sampling error are ±5 percentage points.
In addition to sampling error, question wording and practical difficulties in conducting surveys can introduce error or bias into the findings of public opinion polls.
39. If you were free to do either, would you prefer to have a job outside the home, or would you prefer to stay at home and take care of the house and family?
|
Outside |
Stay |
BOTH |
No |
|
|
% |
% |
% |
% |
|
|
National Adults |
||||
|
2005 Aug 8-11 |
54 |
41 |
4 |
1 |
|
2003 Jun 12-18 |
58 |
38 |
3 |
1 |
|
2002 Jun 3-9 |
59 |
36 |
4 |
1 |
|
2001 Jun 11-17 |
62 |
35 |
2 |
1 |
|
1997 Sep 18-20 ^ |
62 |
30 |
5 |
3 |
|
1996 Apr 13-16 † |
56 |
37 |
5 |
2 |
|
1994 Nov 12-Dec 3 ‡ |
62 |
31 |
-- |
7 |
|
1992 Oct 2-4 • |
56 |
37 |
5 |
2 |
|
1989 Jul 25-30 • |
35 |
51 |
12 |
2 |
|
1984 Aug 25-30 † |
72 |
23 |
-- |
5 |
|
1983 Nov 11-20 < |
58 |
35 |
3 |
4 |
|
Men |
||||
|
2005 Aug 8-11 |
68 |
27 |
3 |
2 |
|
2003 Jun 12-18 |
73 |
24 |
3 |
* |
|
2002 Jun 3-9 |
72 |
24 |
3 |
1 |
|
2001 Jun 11-17 |
73 |
24 |
2 |
1 |
|
1997 Sep 18-20 ^ |
74 |
17 |
5 |
4 |
|
1994 Nov 12-Dec 3 ‡ |
78 |
15 |
-- |
7 |
|
1992 Oct 2-4 ^ |
72 |
21 |
5 |
2 |
|
1989 Jun 22-Aug 12 ‡ |
81 |
13 |
-- |
6 |
|
1985 Mar 1-30 ‡ |
86 |
12 |
-- |
2 |
|
1983 Nov 11-20 < |
72 |
21 |
1 |
6 |
|
Women |
||||
|
2005 Aug 8-11 |
42 |
53 |
4 |
1 |
|
2003 Jun 12-18 |
45 |
51 |
3 |
1 |
|
2002 Jun 3-9 |
47 |
48 |
4 |
1 |
|
2001 Jun 11-17 |
53 |
45 |
2 |
* |
|
1997 Sep 18-20 ^ |
50 |
42 |
6 |
2 |
|
1994 Nov 12-Dec 3 ‡ |
46 |
47 |
-- |
7 |
|
1992 Oct 2-4 ^ |
42 |
51 |
5 |
2 |
|
1989 Jul 22-Aug 12 ‡ |
42 |
51 |
-- |
7 |
|
1985 Mar 1-30 ‡ |
51 |
45 |
-- |
4 |
|
1983 Nov 11-20 < |
45 |
47 |
5 |
3 |
|
1982 Jun 26-28 ^ |
48 |
47 |
-- |
5 |
|
1979 Oct 6-20 ‡ |
46 |
51 |
-- |
3 |
|
1978 Jan 7-21 ‡ |
49 |
45 |
-- |
6 |
|
1974 Apr ‡ |
36 |
60 |
-- |
4 |
|
^ CBS News poll |
||||
|
† Los Angeles Times poll |
||||
|
‡ Roper Organization poll |
||||
|
• CBS News/New York Times poll |
||||
|
< New York Times |
||||
|
(vol.) Volunteered response |
||||
|
* Less than 0.5% |
||||