Story Highlights
- Obama's approval among white non-college grads is 27%
- White college grads (41%) are 14 percentage points higher
- Obama's approval among whites has dropped throughout term
PRINCETON, N.J. -- President Barack Obama's job approval rating among white non-college graduates is at 27% so far in 2014, 14 percentage points lower than among white college graduates. This is the largest yearly gap between these two groups since Obama took office. These data underscore the magnitude of the Democratic Party's problem with working-class whites, among whom Obama lost in the 2012 presidential election, and among whom Democratic House candidates lost in the 2014 U.S. House voting by 30 points.
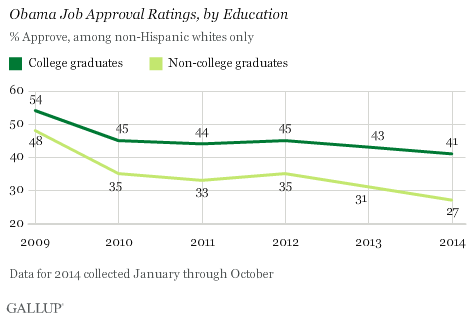
Obama's overall job approval rating has dropped throughout the first six years of his administration, and this downward trajectory is seen both among white Americans who are college graduates and those who are not. But the gap between his approval ratings among college-educated and non-college-educated whites has grown. It was six points in 2009, when Obama had the overall highest ratings of his administration, then expanded to 10 points in 2010 and to 12 points in 2013. The gap between these two groups is at its highest yet, at 14 points so far this year.
Whites in general constitute a political challenge for Democrats and the president given their Republican orientation, as evidenced by Obama's job approval ratings so far this year of 84% among blacks, 64% among Asians, 53% among Hispanics and 32% among whites. About two-thirds of adult whites have not graduated from college, making working-class whites a particularly important group politically because of its sheer size.
Gender and Age
Democrats and the president do better among white women than among white men, and this gender gap is evident among those who are college graduates and those who are not. Obama's approval rating ranges from a high of 45% among white female college graduates to a low of 25% among white male non-college graduates. The eight-point gender gap among white college graduates is twice that among white non-college graduates.
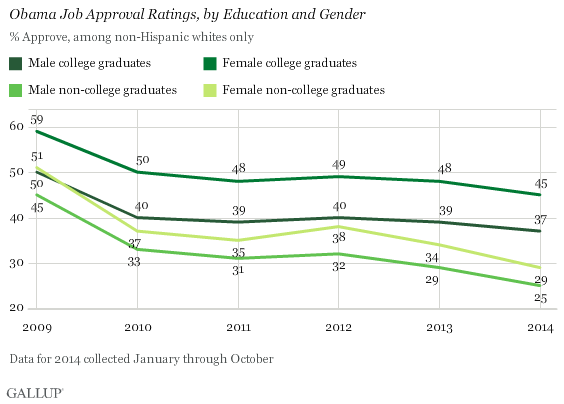
The larger decline in approval among non-college graduates than among college graduates is evident among both men and women.
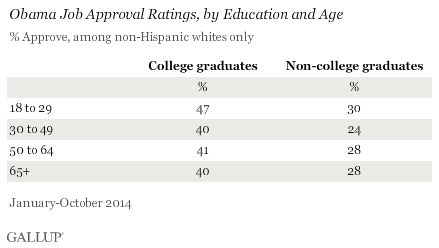
Among whites, Obama does better with younger Americans than with those who are older, but the education gap is evident across all age groups. Approval among 18- to 29-year-old white college graduates is 17 points higher than among 18- to 29-year-old white non-college graduates. Gaps by education are somewhat smaller among those aged 50 and older.
Implications
Given its sheer size, the working-class white population in the U.S. is of keen importance to politicians and strategists on both sides of the aisle, and many discussions and strategy sessions have focused on the complex set of attitudes and life positions which, as evidenced by these data, have pushed this group further from the Democratic president over the past six years. Discussions have also focused on the value of a populist approach to appeal to these voters' economic situations, and the impact of the cultural positions taken by a Democratic party that has as one of its core segments a coalition of minority race and ethnic group members, along with liberals and a smaller segment of highly educated whites. These discussions will continue as the 2016 election campaigns ramp up in the coming two years. At the moment, working-class whites exhibit weak support for the Democrats and their president, and it's not clear how likely that is to change as time goes on.
Survey Methods
Results for this Gallup poll are based on telephone interviews conducted on the Gallup U.S. Daily survey from 2009 through October 2014, with random samples of approximately 355,000 adults, aged 18 and older, living in all 50 U.S. states and the District of Columbia for each of the 2009-2012 yearly samples; approximately 175,000 adults for 2013; and 149,150 adults for January-October 2014. For results based on the total sample of national adults in each yearly average, the margin of sampling error is ±1 percentage point at the 95% confidence level.
Each sample of national adults includes a minimum quota of 50% cellphone respondents and 50% landline respondents, with additional minimum quotas by time zone within region. Landline and cellular telephone numbers are selected using random-digit-dial methods.
Learn more about how the Gallup U.S. Daily works.