Story Highlights
- Averages have remained between -5 and -9 for nine weeks
- Outlook rating remains slightly worse than present conditions
WASHINGTON, D.C. -- Gallup's U.S. Economic Confidence Index was flat for the week ending June 28, at -8. This is consistent with the narrow range of index scores since early May, which have averaged between -5 and -9.
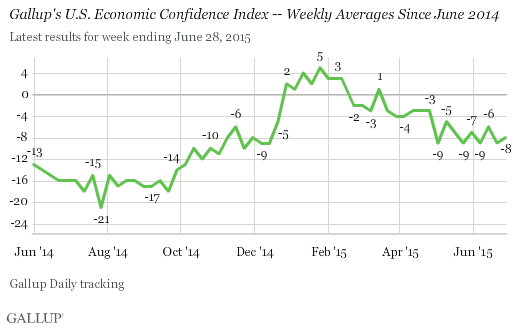
After being predominantly negative since 2008, the Gallup Economic Confidence Index has had three distinct periods in 2015. The first began at the end of 2014 and lasted until late February, and consisted of positive averages between +1 and +5. These were the first positive averages since the recession began, and likely resulted from falling gas prices. The second period, consisting of averages between +1 and -4, lasted from late February -- just after gas prices started to increase -- until late April. Scores in the current third period have consistently been -5 or lower, after the index fell to -9 in first week of May, coinciding with reports of lackluster U.S. economic growth in the first quarter of 2015.
While the current index score of -8 is among the lowest weekly averages found this year, it remains one of the highest scores Gallup has found since it began tracking confidence daily in 2008. Gallup's Economic Confidence Index is the average of two components: how Americans view the current economy and whether they feel the economy is improving or getting worse. The index has a theoretical maximum of +100, if all Americans rate the economy as excellent or good and improving, and a theoretical minimum of -100, if all Americans rate the economy as poor and getting worse.
For the week ending June 28, 24% of Americans said the economy is "excellent" or "good," while 29% said it is "poor." This resulted in a current conditions score of -5, the same as the week before. The economic outlook score was also similar to the week prior, at -11, the result of 42% of Americans saying the economy is "getting better," while 53% said it is "getting worse."
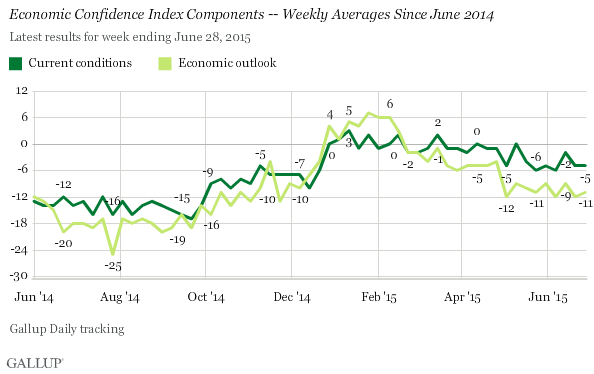
Since early March, Americans' views of the current economy have been more positive than their views of the economy's direction.
Survey Methods
Results for this Gallup poll are based on telephone interviews conducted June 22-28, 2015, on the Gallup U.S. Daily survey, with a random sample of 3,531 adults, aged 18 and older, living in all 50 U.S. states and the District of Columbia. For results based on the total sample of national adults, the margin of sampling error is ±2 percentage points at the 95% confidence level. All reported margins of sampling error include computed design effects for weighting.
Each sample of national adults includes a minimum quota of 50% cellphone respondents and 50% landline respondents, with additional minimum quotas by time zone within region. Landline and cellular telephone numbers are selected using random-digit-dial methods.
Learn more about how Gallup Daily tracking works.