Story Highlights
- Index holds at record high of +32 found in May
- More companies hiring than keeping workforce the same
- Index highest in Midwest at +36, lowest in East at +27
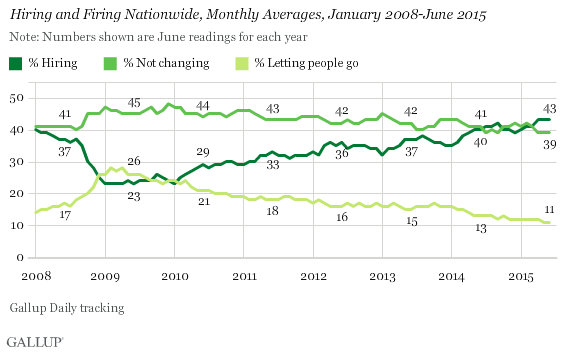
WASHINGTON, D.C. -- Gallup's U.S. Job Creation Index remained high in June at +32. The index score -- based on 43% of workers saying their employer is hiring workers and expanding the size of its workforce and 11% saying their employer is letting workers go and reducing the size of its workforce -- is the same as what Gallup measured in May, which is the highest Gallup has found for the index.
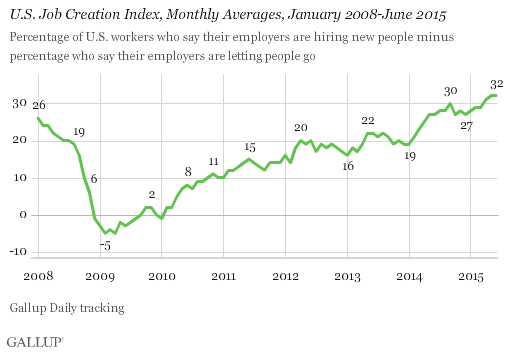
Gallup began tracking job creation in January 2008 as the Great Recession began taking hold in the U.S. economy. While still at a relatively healthy +26 in January 2008, the index went into a deep dive after the 2008 financial crisis. It bottomed out at -5 in early 2009, and remained negative or close to zero for the rest of that year. The index slowly improved after that, reaching a high of +30 in September 2014. After hovering between +27 and +29 for half a year, the index climbed two points in April and another point in May to reach the current highs.
Gallup's Job Creation Index is based on interviews with 16,572 full- and part-time workers in the U.S., conducted June 1-30 on Gallup Daily tracking. Gallup asks employed workers nationwide each day whether their employer is increasing, reducing or maintaining the size of its workforce.
The percentage of workers who say their company is expanding its workforce is not only well above the percentage who say their company is letting people go, but since April, it has also exceeded the percentage who report their workforce is not changing. So far in the index's history, this has only happened a few times.
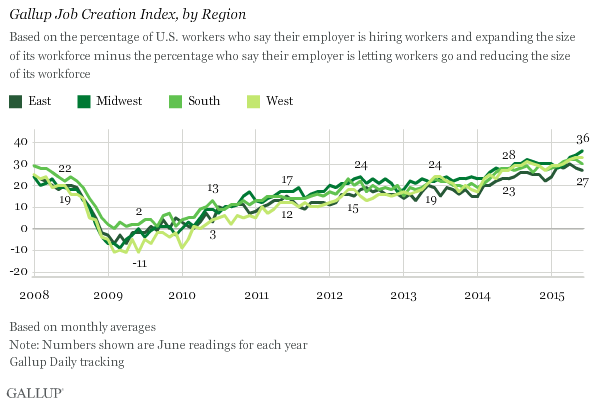
Index Highest in the Midwest, Lowest in the East
Over time, the index score in each region has generally followed the national trend, with a steep decline in 2008 through 2009 and improvement since then, including record highs in recent months. No one region has consistently outperformed the other regions over the last seven years. However, the East continues to slightly lag behind the other regions, as it has since 2013.
The index measured +27 in the East, slightly below the high score of +30 found in April, and the lowest of the four regions in June. The index was highest in the Midwest, where it increased to +36, the highest measure for this region yet. The index was unchanged in the West, at +33, but it dropped slightly in the South to +30.
Implications
In addition to the record-high U.S. Job Creation Index score, based on employees' reports of hiring activity at their place of work, Americans' self-reports of their own working situation -- as measured in the U.S. Payroll to Population employment rate -- is the best since the fall of 2012.
The jobs situation is central to Americans' evaluations of the economy's overall health. And Americans are generally much more upbeat about the state of the U.S. economy now than they have been for the past seven years. However, they still rate economic conditions more negatively than positively overall, and economic confidence is lower now than it was earlier this year.
These data are available in Gallup Analytics.
Survey Methods
Results for this Gallup poll are based on telephone interviews conducted June 1-30, 2015, on the Gallup U.S. Daily survey, with a random sample of 16,572 adults, aged 18 and older, living in all 50 U.S. states and the District of Columbia, who are employed full or part time. For results based on the total sample of employed adults, the margin of sampling error is ±1 percentage point at the 95% confidence level. All reported margins of sampling error include computed design effects for weighting.
Each sample of national adults includes a minimum quota of 50% cellphone respondents and 50% landline respondents, with additional minimum quotas by time zone within region. Landline and cellular telephone numbers are selected using random-digit-dial methods.
Learn more about how Gallup Daily tracking works.