Story Highlights
- Spending last month down slightly from July 2014
- July typically sees only small change in spending vs. June
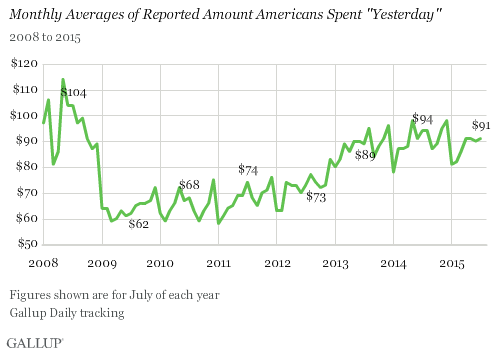
WASHINGTON, D.C. -- Americans' daily self-reports of spending averaged $91 in July, similar to June and essentially unchanged from monthly figures since April. The latest spending average is slightly lower than the average in July 2014, but higher than every other average for July since 2009.
Gallup's daily spending measure asks Americans to estimate the total amount they spent "yesterday" in restaurants, gas stations, stores or online -- not counting home, vehicle or other major purchases, or normal monthly bills -- to provide an indication of Americans' discretionary spending. The July 2015 average is based on Gallup Daily tracking interviews with more than 15,000 U.S. adults.
Americans' reported spending estimates moved little between 2009 and 2012, after the global financial crisis. By late 2012, the metric began to rise and continued to do so into 2013. Since then, it has hovered near the $90 mark, compared with much lower averages closer to $70 from 2009-2012.
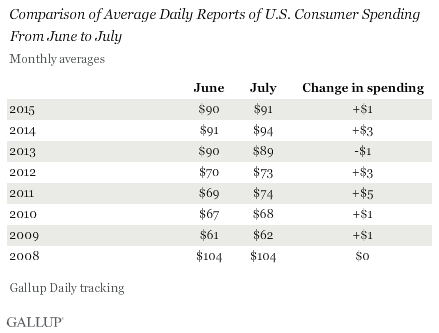
In past years, spending has changed little from June to July -- the largest increase was $5 in 2011. There were slightly smaller increases of $3 in 2012 and 2014.
Bottom Line
The last few months have not seen changes in Americans' reported spending, but this isn't unusual for the middle of the year. The U.S. economy itself has not seen significant growth this year, as GDP grew by 2.3% in the second quarter after growing slightly in the first quarter. The Commerce Department reported that Americans' spending was up in the second quarter compared with the first -- consistent with Gallup's consumer spending figures in those quarters.
Though gas prices remain lower than they were a year ago, which had boosted Americans' confidence in the economy, this does not seem to have had much effect on Americans' overall spending.
These data are available in Gallup Analytics.
Survey Methods
Results for this Gallup poll are based on telephone interviews conducted July 1-31, 2015, on the Gallup U.S. Daily survey, with a random sample of 15,217 adults, aged 18 and older, living in all 50 U.S. states and the District of Columbia. For results based on the total sample of national adults, the margin of sampling error is ±1 percentage point at the 95% confidence level. The margin of error for the spending mean is ±$5. All reported margins of sampling error include computed design effects for weighting.
Each sample of national adults includes a minimum quota of 50% cellphone respondents and 50% landline respondents, with additional minimum quotas by time zone within region. Landline and cellular telephone numbers are selected using random-digit-dial methods.
Learn more about how Gallup Daily tracking works.