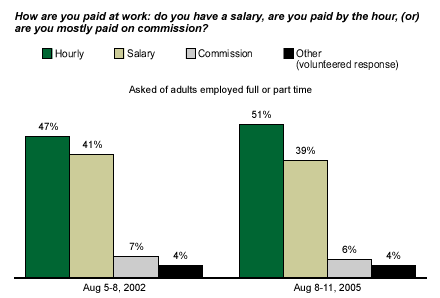
Gallup periodically queries Americans about their job status to better understand what work is like for the typical American worker. The latest update, taken from Gallup's Aug. 8-11 poll*, finds that most American workers currently hold just one job and spend an average of 42 hours a week at work. About one in five employed adults in the country work in blue-collar professions, while the rest work as executives or in some other white-collar profession. Half of workers are paid an hourly wage, while roughly 4 in 10 receive a salary and only 6% are paid mostly on commission.
Jobs Trends
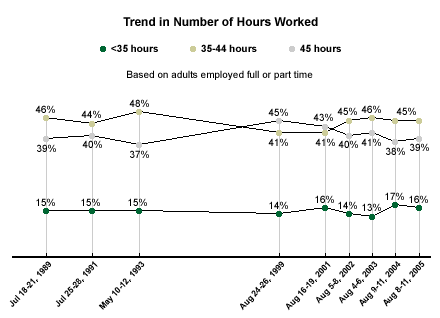
Overall, about 6 in 10 Americans are employed, with roughly half employed full time and about 1 in 10 part time. American employees work 42 hours per week on average (this sample includes respondents who are both full- and part-time workers). This includes 16% of Americans who work fewer than 35 hours per week, 45% who work between 35 and 44 hours, and 39% who work more than 45 hours per week.
The average number of hours people work in a given week has shown only modest fluctuations since 1989, ranging from 42 hours a week to 44 hours a week. However, the trends on this measure show a slight decline in the percentage of Americans working more than 45 hours a week. In 1999, Gallup found that 45% of U.S. workers said they worked 45 hours or more per week. This percentage has slowly and gradually declined since then. The current results are now at levels Gallup recorded from 1989 through 1993. Since 1999, the percentage of workers saying they work between 35 and 44 hours has increased slightly.
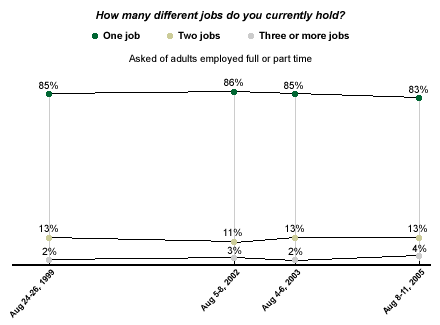
The vast majority of employed adults, 83%, say they currently hold only one job. Thirteen percent have two jobs at the present time, and 4% work three or more jobs. Results on this question have shown essentially no change since it was first asked in 1999.
When workers are asked about the specific type of work they do, about one in four (24%) say they are employed in some professional specialty, in fields such as law, medicine, computer science, engineering, or social work. Twenty percent say they are administrative or managerial executives, with jobs such as chief executive, financial officer, or auditor.
About 1 in 10 workers each categorized their jobs as administrative personnel (12%), operators and laborers (11%), or service (10%). Other general categories of professions mentioned include sales (8%), precision production, craft, and repair (8%), technical (3%), farming, fishing, or forestry (1%), and the military (1%).
|
Being as specific as possible and using any job titles you may have, |
|||
|
|
|
|
|
|
2005 |
2003 |
2002 |
|
|
% |
% |
% |
|
|
Professional Specialty |
24 |
22 |
19 |
|
Executive: Administrative and Managerial |
20 |
15 |
18 |
|
Administrative |
12 |
17 |
13 |
|
Operators, Fabricators and Laborers |
11 |
12 |
11 |
|
Service |
10 |
14 |
12 |
|
Sales |
8 |
8 |
8 |
|
Precision Production, Craft, and Repair |
8 |
6 |
11 |
|
Technical |
3 |
1 |
4 |
|
Farming/Forestry/Fishing |
1 |
1 |
1 |
|
Military |
1 |
2 |
1 |
|
|
|
|
|
|
Other |
2 |
1 |
1 |
|
No Opinion |
* |
1 |
1 |
Half of American employees say they are paid hourly, while 39% receive salaries, and 6% are paid on commission. These results are essentially the same as they were in August 2002.
Variations by Type of Americans' Jobs
In order to better understand the way different groups of American workers describe their current employment situations, Gallup combined the results of its past three surveys on this question from August 2002, August 2003, and August 2005.
Gallup also categorized workers' responses to the type of work they do into three broad categories: professional or executive jobs, which include executives, managers, and specialists; other white-collar jobs, which include technical professions in health, science, and engineering, sales, and administrative personnel; and blue-collar professions, which include service jobs, farming or fishing, repair persons, laborers, and military personnel.
As the table shows, there are some interesting differences by gender, education level, and household income on this measure.
|
Job Description |
|||
|
|
|
|
|
|
Professional/ |
Other |
Blue |
|
|
% |
% |
% |
|
|
Gender |
|
|
|
|
Men |
36 |
29 |
35 |
|
Women |
46 |
48 |
7 |
|
|
|
|
|
|
Education |
|
|
|
|
High school or less |
20 |
43 |
37 |
|
Some college |
34 |
44 |
23 |
|
College graduates |
55 |
37 |
8 |
|
Postgraduate |
79 |
17 |
4 |
- More than 9 in 10 women work in white-collar professions (46% in professional or executive and 48% in other white-collar professions), and just 7% work in blue-collar professions. Among men, 36% work in professional or executive professions, while 29% work in some other white-collar profession, and 35% work in blue-collar jobs.
- Workers with a higher level of education are more likely to describe their jobs as professional or executive. Nearly 8 in 10 workers (79%) with postgraduate education work in a professional or executive job, compared with 55% of those with a college degree, 34% of those with some college education, and 20% of those with a high school education or less.
Differences in Type of Compensation for Workers
The combined results of Gallup's 2002 and 2005 surveys also shows interesting differences in the way in which various groups are paid.
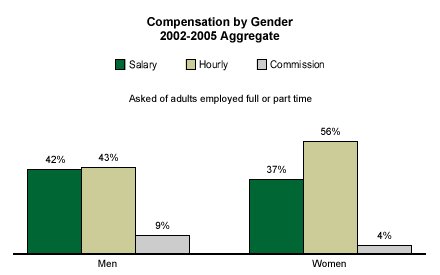
A majority of women (56%) say they are paid hourly wages, while 37% say they are on salary. Among men, compensation is almost equally divided between an hourly wage (43%) and a salary (42%). This difference may reflect the fact that women are more likely than men to be employed part time (11% to 5%), while men are more likely than women to be employed full time (61% to 39%).
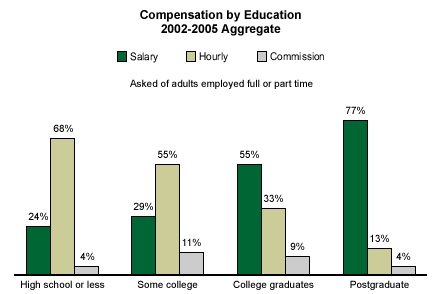
Workers with higher levels of education are more likely to receive salaries than are less educated workers. More than three in four workers with postgraduate education (77%) are on salary, compared with 55% of college graduates, 29% of those with some college education, and 24% of those with a high school education or less.
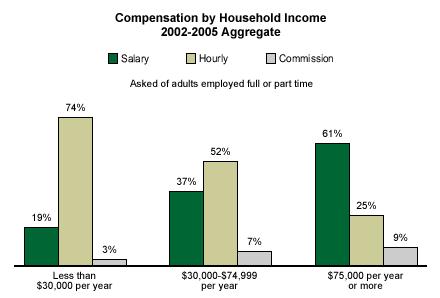
More than 6 in 10 workers in households earning $75,000 per year or more say they are paid salaries. By comparison, nearly three in four workers in households earning less than $30,000 per year are paid hourly.
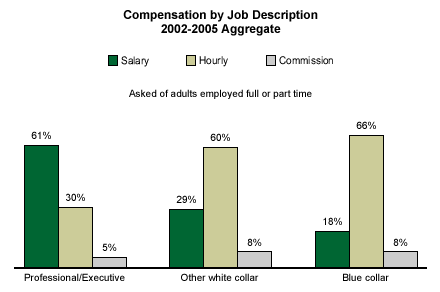
Sixty-one percent of those who are employed as a professional or executive are paid salaries, while 30% are paid hourly. Among other white-collar professionals, 60% are paid by the hour and 29% are paid a salary, and among blue-collar workers, 66% are paid hourly and only 18% are on salary.
*Results are based on telephone interviews with 564 adults employed full or part time, aged 18 and older, conducted Aug. 8-11, 2005. For results based on the total sample of national adults, one can say with 95% confidence that the margin of sampling error is ±4 percentage points.
Results are based on telephone interviews with 1,702 employed adults, aged 18 and older, conducted across four surveys from August 2002 through August 2005, the maximum margin of sampling error is ±3 percentage points.
Results are based on telephone interviews with 1,132 employed adults, aged 18 and older, taken from two surveys conducted August 2002 and August 2005, the maximum margin of sampling error is ±3 percentage points.
In addition to sampling error, question wording and practical difficulties in conducting surveys can introduce error or bias into the findings of public opinion polls.