Story Highlights
- Uninsured rate essentially unchanged throughout 2015
- Rate down 5.2 points since just before key provision of health law took effect
- Uninsured rate has declined most among Hispanics
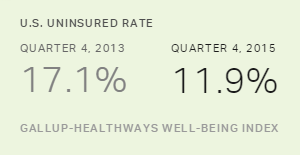
WASHINGTON, D.C. -- In the fourth quarter of 2015, 11.9% of U.S. adults were without health insurance, up slightly from 11.6% in the third quarter and back to where it was in the first quarter of 2015. Still, the uninsured rate declined 5.2 percentage points since the fourth quarter of 2013, right before the key provision of the health law requiring Americans to carry health insurance took effect in early 2014.
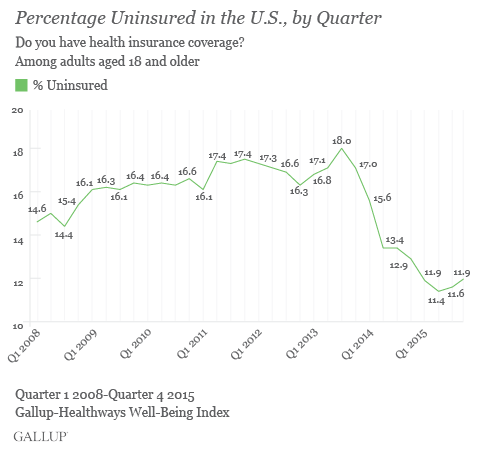
Despite the uninsured rate not changing much over the course of 2015, it has been lower in each quarter compared with the same quarter in 2014.
Results for the fourth quarter are based on nearly 43,000 interviews with U.S. adults aged 18 and older from Oct. 1-Dec. 30, 2015, conducted as part of the Gallup-Healthways Well-Being Index. Gallup and Healthways ask 500 U.S. adults each day whether they have health insurance, which, on an aggregated basis, allows for precise and ongoing measurement of the percentage of Americans with and without health insurance.
Uninsured Rate Declines Most Among Hispanics
Across key subgroups, the largest dip in the uninsured rate since the fourth quarter of 2013 -- right before the key provision of the Affordable Care Act took effect -- has been among Hispanics. The uninsured rate among Hispanics was 30.9% in the fourth quarter of 2015, down 7.8 points from the fourth quarter of 2013. Similarly, the uninsured rate has declined 7.4 points among blacks over this same period. The sharper declines among these groups in part reflect that they had much higher uninsured rates to begin with. Even with the declines over the past two years, blacks and Hispanics still have relatively higher uninsured rates than the rest of the population.
Across income groups, the greatest decline in the uninsured rate has been among lower-income Americans. Among those with an annual household income of $36,000 or less, the uninsured rate declined 8.8 points since the fourth quarter of 2013. Those in lower income households remain far more likely than those in middle- and upper-income households to lack health insurance.
The uninsured rates have declined significantly within age groups since late 2013, with the exception of seniors, most of whom were already covered by Medicare before the recent changes in health insurance.
Large Uptick in Those Paying for Own Health Plan
To assess changes in insurance type, Gallup and Healthways focus on adults aged 18 to 64, because nearly all Americans aged 65 and older have Medicare. The percentage of 18- to 64-year-olds who are covered by an insurance plan fully paid for by themselves or a family member was 21.6% in the fourth quarter, up from 17.6% in the fourth quarter of 2013. The percentages of Americans with Medicaid and Medicare insurance also have increased over this period.
Gallup and Healthways began asking Americans about the source of their health insurance using the current question wording in August 2013, in anticipation of shifts in how people receive their health insurance as a result of the Affordable Care Act. Respondents are asked, "Is your primary health insurance coverage through a current or former employer, a union, Medicare, Medicaid, military or veteran's coverage or a plan fully paid for by you or a family member?" Respondents are also asked if they have secondary health insurance coverage and if so, what type of coverage it is. The results reported here are a combined estimate of primary and secondary insurance types.
Implications
The uninsured rate among U.S. adults dipped in the second and third quarters of 2015, before returning to where it was in the first quarter. Stability in the insurance rate was generally expected in the second, third and fourth quarters of 2015 because the open enrollment period for state and federal health insurance exchanges ended in the first quarter. The uninsured rate in the first quarter of 2016 -- reflecting the start of insurance plans that new enrollees sign up for during the open enrollment period that began in November 2015 and ends on Jan. 31 -- is more likely to show a decline.
The sharp drop in the uninsured rate seen in the first year after the insurance exchanges opened has leveled off in the second year, with smaller declines seen in 2015 compared with 2014. This validates concerns that similarly large reductions may not be possible in the future because the remaining uninsured are harder to reach or less inclined to become insured more generally. Future reductions will likely require significant outreach and expanded programs targeting those who have not yet taken advantage of the health insurance marketplace.
Survey Methods
Results are based on telephone interviews conducted Oct. 1-Dec. 31, 2015, as part of the Gallup-Healthways Well-Being Index survey, with a random sample of 42,998 adults, aged 18 and older, living in all 50 U.S. states and the District of Columbia. For results based on the total sample of national adults, the margin of sampling error is ±1 percentage point at the 95% confidence level. Each quarter dating to Quarter 1, 2014, has approximately 44,000 respondents. Each quarter from 2008 through 2013 has approximately 88,000 respondents.
Each sample of national adults includes a minimum quota of 60% cellphone respondents and 40% landline respondents, with additional minimum quotas by time zone within the region. Landline and cellular telephone numbers are selected using random-digit-dial methods.
Learn more about how the Gallup-Healthways Well-Being Index works.