Story Highlights
- Medicaid expansion, state exchanges linked to greater reductions
- 45 states have had statistically significant declines since 2013
- No states have had statistically significant increases since 2013
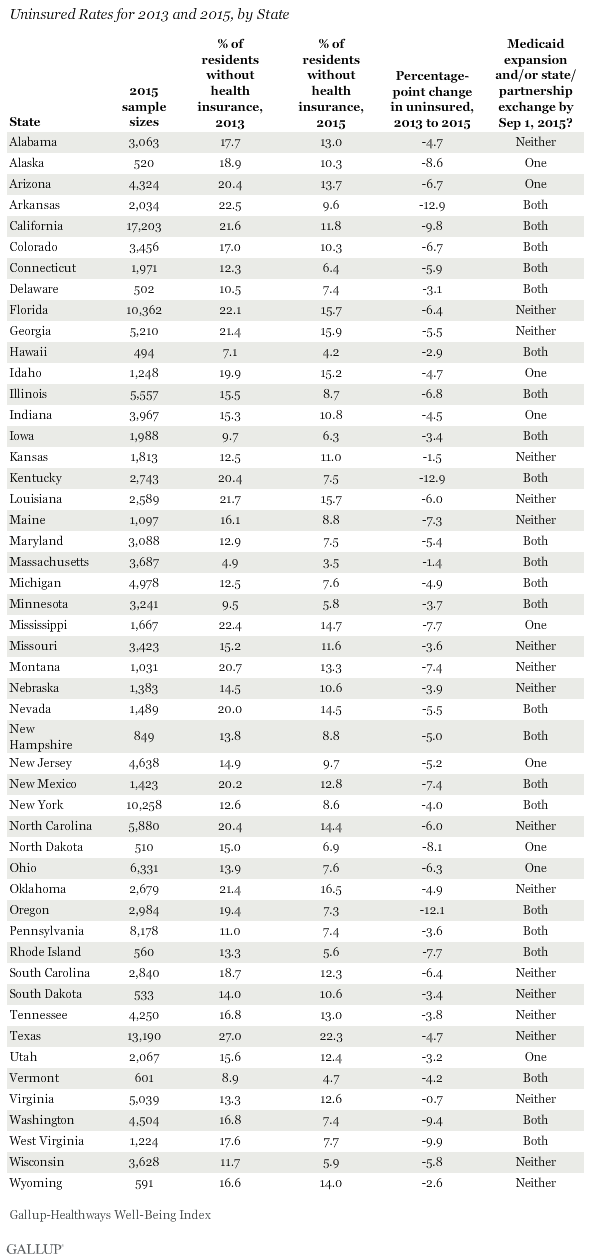
WASHINGTON, D.C. -- Arkansas and Kentucky have had the sharpest net reductions in their uninsured rates since the healthcare law took effect at the beginning of 2014, followed closely by Oregon. West Virginia and California round out the top five states with the greatest declines in the percentage of adult residents without health insurance.
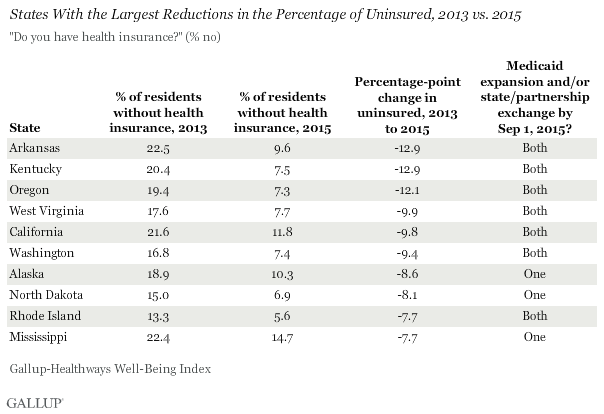
Seven of the 10 states with the largest reductions in uninsured rates have expanded Medicaid and established a state-based marketplace exchange or state-federal partnership, while the remaining three have implemented one or the other. The marketplace exchanges opened on Oct. 1, 2013, with new insurance plans purchased during the last quarter of that year typically starting on Jan. 1, 2014. Medicaid expansion among initially participating states also began at the beginning of 2014. As such, 2013 serves as a benchmark year for uninsured rates before the two major mechanisms of the healthcare law took effect: Medicaid expansion and marketplace exchanges.
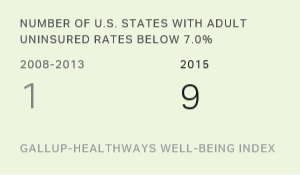
Through the end of 2015, nine states had uninsured rates below 7.0%: Massachusetts, Hawaii, Vermont, Rhode Island, Minnesota, Wisconsin, Iowa, Connecticut and North Dakota. In the six-year span between 2008 and 2013, Massachusetts had been the only state to be at or below this rate in any year. No state has reported a statistically significant increase in its percentage of uninsured in 2015 compared with 2013.
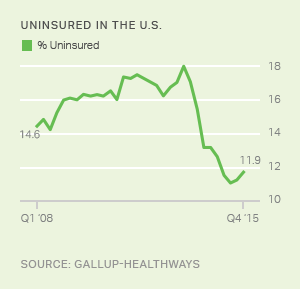
Nationwide, the uninsured rate fell from 17.3% in 2013 to 11.7% in 2015.
States Not Embracing Health Law Less Likely to See Improvement
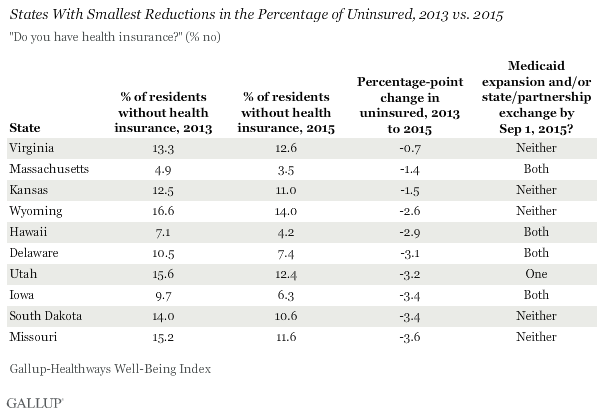
The only states that did not have statistically significant reductions in their respective uninsured rates since 2013 are Virginia, Wyoming, Kansas, Delaware and South Dakota. Four of these five states neither established a locally managed and promoted exchange nor expanded Medicaid -- South Dakota is the exception, having implemented both.
Of the 10 states with the smallest declines since 2013, half have not implemented either of these major mechanisms of the Affordable Care Act (ACA). Four other states have implemented both -- Massachusetts, Hawaii, Delaware and Iowa -- and these were among the lowest six uninsured states nationwide in 2013, and thus they had less room for further reduction than most others.
These data, collected as part of the Gallup-Healthways Well-Being Index, are based on Americans' answers to the question, "Do you have health insurance coverage?" These state-level data are based on daily surveys conducted from January through December 2015 and include sample sizes that range from 494 randomly selected adult residents in Hawaii to more than 17,000 in California. The data for 2013 were collected over the same 12-month period and yielded sample sizes similar to those in 2015 for each state. A full list of the 2013 and 2015 uninsured rates for all 50 states appears at the end of the article.
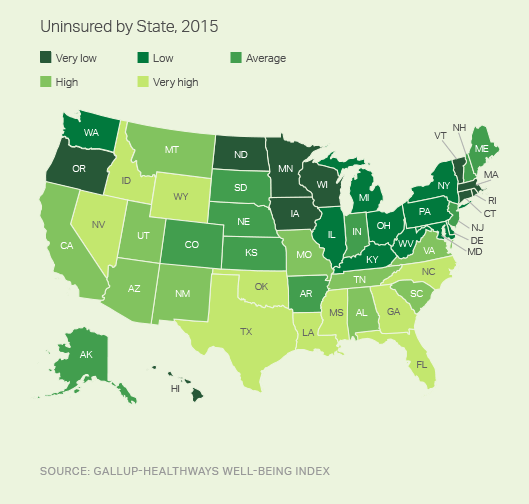
For the eighth year in a row, Massachusetts had the lowest uninsured rate nationally, and Texas had the highest. In general, Southern, Southwestern and Mountain West states have the highest uninsured rates in the U.S.
Implications
Americans' attitudes about the health law known as "Obamacare" have shown little change since 2013. More Americans continue to disapprove of the law than approve of it, even as uninsured rates for nearly all states have declined since that time. Political identity is closely related to approval or disapproval of the ACA, so entrenched attitudes toward the Obama presidency are likely driving the stability in Americans' views of the ACA.
The Gallup-Healthways Well-Being Index does not provide estimates for the number of American adults who have gained insurance or the number who have lost insurance during the ACA era. Rather, it measures the net change in the uninsured rate, which reflects both effects simultaneously. As such, the national decline from 17.3% without insurance in 2013 to 11.7% in 2015 represents a net increase of about 13.7 million adults with health insurance over this two-year period.
Medicaid expansion, one of the two major uninsured reduction mechanisms of the ACA, continues to slowly spread nationally. In addition to Alaska's implementation, effective Sept. 1, 2015, Montana cleared federal waiver approval and has officially expanded Medicaid effective Jan. 1, 2016; thus, the two have become the 29th and 30th states (plus the District of Columbia) to expand. Louisiana is in the process of expanding its coverage, and will become the 31st state to do so once the wider coverage is in effect.
With 19 states still eligible to expand Medicaid, this mechanism for reducing the uninsured rate continues to have the potential to be effective. But in most of the remaining states, there is substantial political opposition to taking that step. Still, some states such as Utah continue to debate expansion, and a few others such as South Dakota and Virginia have included aspects of expansion in their fiscal year 2017 budgets. Unless most of the remaining states choose to expand, however, the marketplace exchanges that enable people to select and purchase their own plan directly from insurers will likely be the primary means by which the national uninsured rate might continue to decline in the immediate future.
Survey Methods
Results are based on telephone interviews conducted Jan. 2-Dec. 30, 2013, and Jan. 2-Dec. 30, 2015, as part of the Gallup-Healthways Well-Being Index, with a random sample of 178,072 adults in 2013 and 177,281 adults in 2015, aged 18 and older, living in all 50 U.S. states and the District of Columbia. The margin of sampling error is ±1 to ±2 percentage points for most states, but climbs as high as ±4 percentage points for 2015 results for states with small populations such as North Dakota, Wyoming, Vermont and Alaska. All reported margins of sampling error include computed design effects for weighting.
For data collected before Sept. 1, 2015, each daily sample of national adults includes a minimum quota of 50% cellphone respondents and 50% landline respondents. For data collected between Sept. 1, 2015, and Dec. 30, 2015, each daily sample of national adults includes a minimum quota of 60% cellphone respondents and 40% landline respondents. Additional minimum quotas are by time zone within region.
Some states have chosen to implement state-federal "partnership" exchanges, where states manage certain functions and make key decisions based on local market and demographic conditions. For the purposes of this analysis, these partnerships are included with the state exchanges. States with Medicaid expansion that occurred after Sept. 1, 2015, were excluded from the "States with Medicaid Expansion and State Exchange/Partnerships" group. Four states -- North Dakota, New Jersey, Ohio and Arizona -- decided to expand Medicaid without also administering a state-based exchange or partnership.
Learn more about how the Gallup-Healthways Well-Being Index works.