Story Highlights
- 20% of Americans say they want divided government
- Fewer Republicans want divided government now than four years ago
- Fewer Democrats want the same party to control Congress than four years ago
WASHINGTON, D.C. -- One in five Americans believe it is best for the president to be from one political party and for Congress to be controlled by another, the lowest level of public support for divided government in Gallup's 15-year trend. The remainder are evenly divided between those who favor one party controlling both the presidency and Congress (36%) and those saying it makes no difference how political power is allocated (36%).
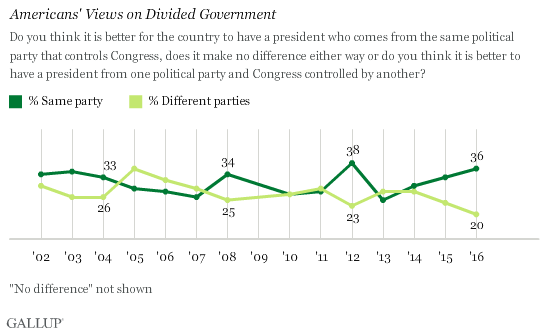
Americans' current preference for one party controlling both the presidency and Congress is near the record high of 38% from four years ago. That fits with a pattern of heightened support for single-party control seen in the past two presidential election years. In 2004, the preferences were more evenly divided. These results are based on Gallup's annual Governance poll, conducted Sept. 7-11.
Divided government has been a regular occurrence in Washington, D.C., since 1969, with one party controlling the presidency and Congress for a little more than 12 of those years -- 1977-1981, 1993-1995, 2003-2007, 2009-2011 and part of 2001. Looking back on the last five decades, Americans may be uncomfortable giving one party full control of the federal government. This may have compelled voters to restore divided government in three recent midterm elections (1994, 2006 and 2010) after two or four years when one party had controlled both the White House and Capitol Hill.
Fewer Republicans Prefer Divided Government
Party groups' preference for single-party control of the presidency and Congress during the past few presidential election years depends on the party in control of the presidency. In 2004, when Republican George W. Bush was in the White House, 44% of GOP voters said they wanted the same party to control Congress and the presidency, compared with 26% of Democrats who expressed a similar sentiment. Eight years later, when Democrat Barack Obama was seeking re-election, party views were flipped -- 49% of Democrats said they wanted the same party to control Congress and the presidency, versus 36% of Republicans. This year, however, there is little difference in these views among the two groups.
| 2004 | 2008 | 2012 | 2016 | |||||||||||||||||||||||||||||||||||||||||||||||||||||||||||||||||||||||||||||||||||||||||||||||||
|---|---|---|---|---|---|---|---|---|---|---|---|---|---|---|---|---|---|---|---|---|---|---|---|---|---|---|---|---|---|---|---|---|---|---|---|---|---|---|---|---|---|---|---|---|---|---|---|---|---|---|---|---|---|---|---|---|---|---|---|---|---|---|---|---|---|---|---|---|---|---|---|---|---|---|---|---|---|---|---|---|---|---|---|---|---|---|---|---|---|---|---|---|---|---|---|---|---|---|---|---|
| % | % | % | % | |||||||||||||||||||||||||||||||||||||||||||||||||||||||||||||||||||||||||||||||||||||||||||||||||
| Republicans | ||||||||||||||||||||||||||||||||||||||||||||||||||||||||||||||||||||||||||||||||||||||||||||||||||||
| Same party | 44 | 46 | 36 | 42 | ||||||||||||||||||||||||||||||||||||||||||||||||||||||||||||||||||||||||||||||||||||||||||||||||
| Different parties | 17 | 21 | 27 | 19 | ||||||||||||||||||||||||||||||||||||||||||||||||||||||||||||||||||||||||||||||||||||||||||||||||
| Makes no difference | 36 | 29 | 31 | 29 | ||||||||||||||||||||||||||||||||||||||||||||||||||||||||||||||||||||||||||||||||||||||||||||||||
| Independents | ||||||||||||||||||||||||||||||||||||||||||||||||||||||||||||||||||||||||||||||||||||||||||||||||||||
| Same party | 26 | 23 | 27 | 28 | ||||||||||||||||||||||||||||||||||||||||||||||||||||||||||||||||||||||||||||||||||||||||||||||||
| Different parties | 30 | 29 | 30 | 27 | ||||||||||||||||||||||||||||||||||||||||||||||||||||||||||||||||||||||||||||||||||||||||||||||||
| Makes no difference | 38 | 35 | 35 | 38 | ||||||||||||||||||||||||||||||||||||||||||||||||||||||||||||||||||||||||||||||||||||||||||||||||
| Democrats | ||||||||||||||||||||||||||||||||||||||||||||||||||||||||||||||||||||||||||||||||||||||||||||||||||||
| Same party | 26 | 35 | 49 | 40 | ||||||||||||||||||||||||||||||||||||||||||||||||||||||||||||||||||||||||||||||||||||||||||||||||
| Different parties | 32 | 22 | 13 | 14 | ||||||||||||||||||||||||||||||||||||||||||||||||||||||||||||||||||||||||||||||||||||||||||||||||
| Makes no difference | 38 | 39 | 32 | 37 | ||||||||||||||||||||||||||||||||||||||||||||||||||||||||||||||||||||||||||||||||||||||||||||||||
| Gallup | ||||||||||||||||||||||||||||||||||||||||||||||||||||||||||||||||||||||||||||||||||||||||||||||||||||
The percentage of Democrats who want the same party to control government is now 40%, down from 49% in 2012. However, Democrats' preference for divided government is essentially unchanged; it is now 14%, versus 13% in 2012. In the four most recent presidential election years, the percentage of Democrats who have said the division of power in Washington "makes no difference" has stayed relatively consistent, between 32% and 39%.
Independents tend to be indifferent on retaining divided government, at 38% "makes no difference." Unlike views of Democrats or Republicans, independents' views on this issue have not fluctuated much in the four most recent presidential election years. Independents notably are much less likely than both major parties in 2016 to say they want the same party to control the political branches of government.
Bottom Line
Since President Richard Nixon was paired with a Democratic Congress in 1969, party control of the political branches of the U.S. government has usually been divided. For nearly the past six years, the federal government has operated under this arrangement, with Obama having to work with at least one Republican-controlled branch of Congress. In recent presidential election years dating back to 2008, Americans' preference for the "same party" controlling the government has been more pronounced than in non-presidential years. This is likely because many Americans have witnessed the government increasingly in gridlock, believing that legislation will get passed only if there is one party in control and that party pushes it through.
In a presidential election year, Americans may hope that their party will gain control of the legislative and executive branches of government and pass legislation with which they agree. During the Obama presidency, one notable example was the Affordable Care Act, which Democrats passed without Republican support in the House of Representatives or the Senate.
In recent past election years, those who supported the party of the president in office tended to want the same party to control both political branches of the U.S. government. For example, in 2004, more Republicans than Democrats wanted same-party rule, and the opposite occurred when a Democrat was in the White House in 2012.
This year, relatively few Democrats or Republicans wish for divided government. In addition to each group possibly feeling optimistic about their party's chances in the election, another reason so few support divided government could be a desire to overcome political gridlock and pass legislation. In any case, Americans have no clear preference for whether the same party should control both political branches or whether it makes no difference.
Historical data are available in Gallup Analytics.
Survey Methods
Results for this Gallup poll are based on telephone interviews conducted Sept. 7-11, 2016, with a random sample of 1,020 adults, aged 18 and older, living in all 50 U.S. states and the District of Columbia. For results based on the total sample of national adults, the margin of sampling error is ±4 percentage points at the 95% confidence level. All reported margins of sampling error include computed design effects for weighting.
Each sample of national adults includes a minimum quota of 60% cellphone respondents and 40% landline respondents, with additional minimum quotas by time zone within region. Landline and cellular telephone numbers are selected using random-digit-dial methods.
View survey methodology, complete question responses and trends.
Learn more about how the Gallup Poll Social Series works.