Story Highlights
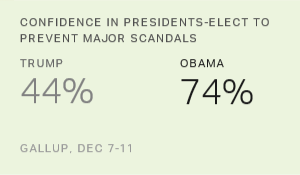
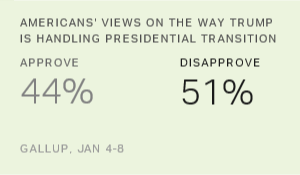
- More Americans disapprove (51%) than approve (44%) of Trump's transition
- His transition approval fell most among political independents
- Majority consider Cabinet picks "average" or better, but 44% rate them as subpar
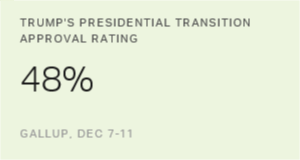
WASHINGTON, D.C. -- In Gallup polling conducted two weeks before Inauguration Day, President-elect Donald Trump continues to garner historically low approval for his transition performance, with 51% of Americans disapproving of how he is handling the presidential transition and 44% approving. Last month, the public was split on this question, with 48% approving and 48% disapproving.
| Approve | Disapprove | No opinion | ||||||||||||||||||||||||||||||||||||||||||||||||||||||||||||||||||||||||||||||||||||||||||||||||||
|---|---|---|---|---|---|---|---|---|---|---|---|---|---|---|---|---|---|---|---|---|---|---|---|---|---|---|---|---|---|---|---|---|---|---|---|---|---|---|---|---|---|---|---|---|---|---|---|---|---|---|---|---|---|---|---|---|---|---|---|---|---|---|---|---|---|---|---|---|---|---|---|---|---|---|---|---|---|---|---|---|---|---|---|---|---|---|---|---|---|---|---|---|---|---|---|---|---|---|---|---|
| % | % | % | ||||||||||||||||||||||||||||||||||||||||||||||||||||||||||||||||||||||||||||||||||||||||||||||||||
| Donald Trump | ||||||||||||||||||||||||||||||||||||||||||||||||||||||||||||||||||||||||||||||||||||||||||||||||||||
| 2017 Jan 4-8 ^ | 44 | 51 | 4 | |||||||||||||||||||||||||||||||||||||||||||||||||||||||||||||||||||||||||||||||||||||||||||||||||
| 2016 Dec 7-11 | 48 | 48 | 4 | |||||||||||||||||||||||||||||||||||||||||||||||||||||||||||||||||||||||||||||||||||||||||||||||||
| Barack Obama | ||||||||||||||||||||||||||||||||||||||||||||||||||||||||||||||||||||||||||||||||||||||||||||||||||||
| 2009 Jan 9-11 | 83 | 12 | 5 | |||||||||||||||||||||||||||||||||||||||||||||||||||||||||||||||||||||||||||||||||||||||||||||||||
| 2008 Dec 12-14 | 75 | 17 | 8 | |||||||||||||||||||||||||||||||||||||||||||||||||||||||||||||||||||||||||||||||||||||||||||||||||
| 2008 Dec 1 † | 78 | 13 | 9 | |||||||||||||||||||||||||||||||||||||||||||||||||||||||||||||||||||||||||||||||||||||||||||||||||
| George W. Bush | ||||||||||||||||||||||||||||||||||||||||||||||||||||||||||||||||||||||||||||||||||||||||||||||||||||
| 2001 Jan 15-16 | 61 | 25 | 14 | |||||||||||||||||||||||||||||||||||||||||||||||||||||||||||||||||||||||||||||||||||||||||||||||||
| 2001 Jan 5-7 | 65 | 26 | 9 | |||||||||||||||||||||||||||||||||||||||||||||||||||||||||||||||||||||||||||||||||||||||||||||||||
| Bill Clinton | ||||||||||||||||||||||||||||||||||||||||||||||||||||||||||||||||||||||||||||||||||||||||||||||||||||
| 1993 Jan 14-15 ‡ | 68 | 18 | 15 | |||||||||||||||||||||||||||||||||||||||||||||||||||||||||||||||||||||||||||||||||||||||||||||||||
| 1992 Dec 18-20 | 67 | 15 | 18 | |||||||||||||||||||||||||||||||||||||||||||||||||||||||||||||||||||||||||||||||||||||||||||||||||
| 1992 Nov 19-20 ‡ | 62 | 14 | 24 | |||||||||||||||||||||||||||||||||||||||||||||||||||||||||||||||||||||||||||||||||||||||||||||||||
| ^ Asked of a half-sample; † USA Today/Gallup poll on Gallup Daily tracking survey; ‡ Gallup/Newsweek poll | ||||||||||||||||||||||||||||||||||||||||||||||||||||||||||||||||||||||||||||||||||||||||||||||||||||
| Gallup | ||||||||||||||||||||||||||||||||||||||||||||||||||||||||||||||||||||||||||||||||||||||||||||||||||||
Trump's 48% transition approval rating in December was already the lowest for any presidential transition Gallup has measured, starting with Bill Clinton's in 1992-1993. Trump's current rating only further separates him from his predecessors -- particularly Barack Obama, who earned 83% approval for his handling of the transition process in January 2009, up from 75% in mid-December 2008.
Republicans' rating of Trump's transition has remained positive, with 87% approving in the Jan. 4-8 poll, similar to the 86% recorded last month. Very few Democrats approve, which has also been fairly steady, at 13% this month versus 17% in December. Meanwhile, his transition approval among independents has fallen from 46% to 33%.
Low Transition Approval Not a Function of Popular Vote
The last president before Trump to win the election despite losing the national popular vote was George W. Bush in 2000. However, while Bush's transition scores were lower than those of both his predecessor (Clinton) and his successor (Obama), his 61% approval rating in mid-January 2001 was nowhere near as low as Trump's is today.
Clinton received the smallest share of the U.S. popular vote (43%) of any of the past four presidents because a large segment of votes went to third-party candidate Ross Perot. Nevertheless, 62% of Americans approved of his handling of the transition process shortly after the election in November 1992, and by January 1993, his approval had risen to 68%.
Trump's Cabinet Garners Lukewarm Reception
Americans' reviews of Trump's Cabinet-level appointments are mixed. In total, 52% say his Cabinet choices are "average" or better, of which 32% rate them as "outstanding" or "above average." At the same time, 44% consider them "below average" or "poor."
Looking at both positive and negative ratings, Americans view Trump's Cabinet as worse than the Cabinets chosen by Obama, Bush and Clinton. However, taking into account just the percentage who consider his Cabinet "above average" or "outstanding," Trump's 32% is only modestly lower than the 38% for Bush in January 2001 and matches Clinton's just before his inauguration in mid-January 1993. Only Obama's 45% was significantly better.
The chief differentiator for Trump is that many more Americans rate his appointments as "below average" or "poor": 44% say this about Trump's Cabinet choices, compared with 13% for Bush's, 12% for Clinton's and 10% for Obama's. The wide spread between positive and negative views of Trump's Cabinet appointments serves as another example of the highly polarized environment in which Trump will be taking office on Jan. 20.
Relatively few Americans call Trump's appointments "average" (20%) compared with those who said the same about Clinton's (51%), Bush's (43%) and Obama's (38%).
| Outstanding/Above average | Average | Below average/Poor | No opinion | |||||||||||||||||||||||||||||||||||||||||||||||||||||||||||||||||||||||||||||||||||||||||||||||||
|---|---|---|---|---|---|---|---|---|---|---|---|---|---|---|---|---|---|---|---|---|---|---|---|---|---|---|---|---|---|---|---|---|---|---|---|---|---|---|---|---|---|---|---|---|---|---|---|---|---|---|---|---|---|---|---|---|---|---|---|---|---|---|---|---|---|---|---|---|---|---|---|---|---|---|---|---|---|---|---|---|---|---|---|---|---|---|---|---|---|---|---|---|---|---|---|---|---|---|---|---|
| % | % | % | % | |||||||||||||||||||||||||||||||||||||||||||||||||||||||||||||||||||||||||||||||||||||||||||||||||
| Donald Trump | ||||||||||||||||||||||||||||||||||||||||||||||||||||||||||||||||||||||||||||||||||||||||||||||||||||
| 2017 Jan 4-8 ^ | 32 | 20 | 44 | 4 | ||||||||||||||||||||||||||||||||||||||||||||||||||||||||||||||||||||||||||||||||||||||||||||||||
| Barack Obama | ||||||||||||||||||||||||||||||||||||||||||||||||||||||||||||||||||||||||||||||||||||||||||||||||||||
| 2009 Jan 9-11 ^ | 45 | 38 | 10 | 7 | ||||||||||||||||||||||||||||||||||||||||||||||||||||||||||||||||||||||||||||||||||||||||||||||||
| George W. Bush | ||||||||||||||||||||||||||||||||||||||||||||||||||||||||||||||||||||||||||||||||||||||||||||||||||||
| 2001 Jan 5-7 | 38 | 43 | 13 | 6 | ||||||||||||||||||||||||||||||||||||||||||||||||||||||||||||||||||||||||||||||||||||||||||||||||
| Bill Clinton | ||||||||||||||||||||||||||||||||||||||||||||||||||||||||||||||||||||||||||||||||||||||||||||||||||||
| 1993 Jan 18-19 | 32 | 51 | 12 | 5 | ||||||||||||||||||||||||||||||||||||||||||||||||||||||||||||||||||||||||||||||||||||||||||||||||
| 1992 Dec 18-20 | 32 | 43 | 9 | 16 | ||||||||||||||||||||||||||||||||||||||||||||||||||||||||||||||||||||||||||||||||||||||||||||||||
| ^ Asked of a half-sample | ||||||||||||||||||||||||||||||||||||||||||||||||||||||||||||||||||||||||||||||||||||||||||||||||||||
| Gallup | ||||||||||||||||||||||||||||||||||||||||||||||||||||||||||||||||||||||||||||||||||||||||||||||||||||
Bottom Line
Trump has done many things since the election that some might have expected would win him public support -- including reaching out to former political opponents, selecting generals for key Cabinet posts at a time when confidence in the U.S. military is high and brokering deals to keep manufacturing jobs in the U.S.
At the same time, he has maintained an aggressive posture with the press, publicly challenged U.S. intelligence agencies and waded into sensitive foreign policy matters on Twitter. Whatever the reasons, Trump's approach since Nov. 8 has not softened Americans' concerns about him, as a slight majority now disapprove of how he is handling the presidential transition.
Americans give Trump marginally positive reviews for his Cabinet appointments, with a majority rating them "average" or better, but a record-high percentage of Americans view them negatively.
Trump's inauguration speech on Jan. 20 presents a major opportunity for the soon-to-be 45th president to alter how Americans view him, but after that, his image will depend more on how his actions affect real-world outcomes including the economy, healthcare costs, taxes and national security.
Survey Methods
Results for this Gallup poll are based on telephone interviews conducted Jan. 4-8, 2017, with a random sample of 1,032 adults, aged 18 and older, living in all 50 U.S. states and the District of Columbia. For results based on the total sample of national adults, the margin of sampling error is ±4 percentage points at the 95% confidence level. All reported margins of sampling error include computed design effects for weighting.
Each sample of national adults includes a minimum quota of 70% cellphone respondents and 30% landline respondents, with additional minimum quotas by time zone within region. Landline and cellular telephone numbers are selected using random-digit-dial methods.
View survey methodology, complete question responses and trends.
Learn more about how the Gallup Poll Social Series works.