Story Highlights
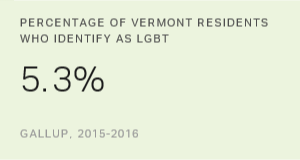
- 5.3% in Vermont identify as LGBT
- South Dakota lowest at 2.0%
- Biggest increases in the Pacific region
WASHINGTON, D.C. -- Vermont tops a new ranking of states by the portion of adults in 2015 and 2016 who identify themselves as lesbian, gay, bisexual or transgender (LGBT) at 5.3%. Massachusetts (4.9%), California (4.9%), Oregon (4.9%) and Nevada (4.8%) round out the top five.
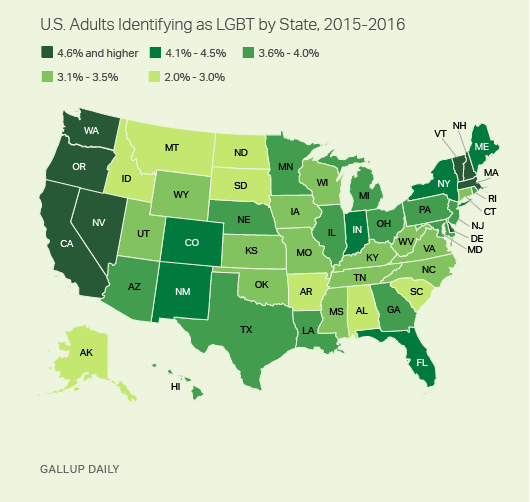
The District of Columbia's 8.6% LGBT exceeds that of any of the states. States with the lowest percentage of LGBT-identifying residents include South Dakota (2.0%), North Dakota (2.7%), Idaho (2.8%), South Carolina (3.0%) and Montana (3.0%).
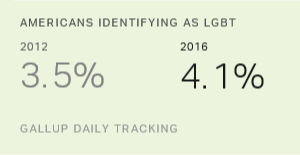
These figures are based on combined 2015 and 2016 data from more than 400,000 interviews and update Gallup's state-level estimates from 2012. Consistent with Gallup research showing national increases in the percentage of adults identifying as LGBT from 3.5% in 2012 to 4.1% in 2016, the vast majority of states and the District of Columbia (42 out of 51) also report increases. However, most of the state-level changes are not statistically significant.
LGBT Identification Highest in the Pacific Region
At 4.9%, the Pacific region, which includes the West Coast, Alaska and Hawaii, has the highest portion of LGBT-identifying adults among eight regions in the U.S. The Pacific region also had the largest percentage-point increase (0.7 points) from 2012/2013 to 2015/2016. This change nudged it ahead of New England (4.5%), which reported a more modest 0.2-point increase.
The Middle Atlantic and Rocky Mountain regions also reported large increases (each 0.5 points) in the portion of adults identifying as LGBT. Among all regions, the West Central region continues to have the lowest percentage who identify as LGBT, but also showed a relatively large gain from 2.9% to 3.4%.
| Region | 2012-2013 | 2015-2016 | Change | ||||||||||||||||||||||||||||||||||||||||||||||||||||||||||||||||||||||||||||||||||||||||||||||||
|---|---|---|---|---|---|---|---|---|---|---|---|---|---|---|---|---|---|---|---|---|---|---|---|---|---|---|---|---|---|---|---|---|---|---|---|---|---|---|---|---|---|---|---|---|---|---|---|---|---|---|---|---|---|---|---|---|---|---|---|---|---|---|---|---|---|---|---|---|---|---|---|---|---|---|---|---|---|---|---|---|---|---|---|---|---|---|---|---|---|---|---|---|---|---|---|---|---|---|---|
| % | % | pct. pts. | |||||||||||||||||||||||||||||||||||||||||||||||||||||||||||||||||||||||||||||||||||||||||||||||||
| Pacific (Calif., Ore., Wash., Hawaii, Alaska) | 4.2 | 4.9 | +0.7 | ||||||||||||||||||||||||||||||||||||||||||||||||||||||||||||||||||||||||||||||||||||||||||||||||
| New England (Maine, N.H., Vt., Mass., R.I., Conn.) | 4.3 | 4.5 | +0.2 | ||||||||||||||||||||||||||||||||||||||||||||||||||||||||||||||||||||||||||||||||||||||||||||||||
| Middle Atlantic (N.Y., N.J., Pa., Md., Del., W.Va., D.C.) | 3.7 | 4.2 | +0.5 | ||||||||||||||||||||||||||||||||||||||||||||||||||||||||||||||||||||||||||||||||||||||||||||||||
| Rocky Mountain (Mont., Ariz., Colo., Idaho, Wyo., Utah, Nev., N.M.) | 3.3 | 3.8 | +0.5 | ||||||||||||||||||||||||||||||||||||||||||||||||||||||||||||||||||||||||||||||||||||||||||||||||
| East Central/Great Lakes (Ohio, Mich., Ind., Ill.) | 3.5 | 3.8 | +0.3 | ||||||||||||||||||||||||||||||||||||||||||||||||||||||||||||||||||||||||||||||||||||||||||||||||
| Southeast (Va., N.C., S.C., Ga., Fla., Ky., Tenn., Ala., Miss.) | 3.2 | 3.6 | +0.4 | ||||||||||||||||||||||||||||||||||||||||||||||||||||||||||||||||||||||||||||||||||||||||||||||||
| Southwest (Ark., La., Okla., Texas) | 3.2 | 3.5 | +0.3 | ||||||||||||||||||||||||||||||||||||||||||||||||||||||||||||||||||||||||||||||||||||||||||||||||
| West Central (Wis., Minn., Iowa, Mo., N.D., S.D., Neb., Kan.) | 2.9 | 3.4 | +0.5 | ||||||||||||||||||||||||||||||||||||||||||||||||||||||||||||||||||||||||||||||||||||||||||||||||
| Gallup-Healthways Well-Being Index | |||||||||||||||||||||||||||||||||||||||||||||||||||||||||||||||||||||||||||||||||||||||||||||||||||
Multiple Factors Help Explain the Increases
A variety of factors influence changes in the portion of adults identifying as LGBT over time. Gallup research documents ongoing increases in the social acceptance of LGBT individuals in the U.S. Growing public acceptance can affect, and likely increase, the willingness of LGBT individuals to identify as such on surveys.
Nationally, virtually all of the increases in LGBT identification over the past five years are among millennials. Their coming of age at a time of greater social acceptance toward LGBT individuals may contribute to disproportionate increases in LGBT identity across states. As the youngest millennials reach 18 and enter Gallup's national adult surveys, their influence on the national survey estimates increases proportionally. A third factor could be mobility: LGBT individuals, in theory, could be more likely to move to parts of the country with greater social acceptance. Other research, however, suggests that the chances of moving away from where one lived as a teenager do not vary much by sexual orientation. As a result, it's unlikely that mobility plays a strong role in explaining differences in LGBT identity by state or region over time.
State-level rankings by the portion of adults identifying as LGBT clearly relate to the regional differences in LGBT social acceptance, which tend to be higher in the East and West and lower in the South and Midwest. Nevada is the only state in the top 10 that doesn't have a coastal border. States ranked in the bottom 10 are dominated by those in the Midwest and South.
| Millennials | Legality of gay/lesbian relations | ||||||||||||||||||||||||||||||||||||||||||||||||||||||||||||||||||||||||||||||||||||||||||||||||||
|---|---|---|---|---|---|---|---|---|---|---|---|---|---|---|---|---|---|---|---|---|---|---|---|---|---|---|---|---|---|---|---|---|---|---|---|---|---|---|---|---|---|---|---|---|---|---|---|---|---|---|---|---|---|---|---|---|---|---|---|---|---|---|---|---|---|---|---|---|---|---|---|---|---|---|---|---|---|---|---|---|---|---|---|---|---|---|---|---|---|---|---|---|---|---|---|---|---|---|---|
| % of population | % should be legal | ||||||||||||||||||||||||||||||||||||||||||||||||||||||||||||||||||||||||||||||||||||||||||||||||||
| New England | 31 | 92 | |||||||||||||||||||||||||||||||||||||||||||||||||||||||||||||||||||||||||||||||||||||||||||||||||
| Middle Atlantic | 33 | 77 | |||||||||||||||||||||||||||||||||||||||||||||||||||||||||||||||||||||||||||||||||||||||||||||||||
| East Central/Great Lakes | 30 | 63 | |||||||||||||||||||||||||||||||||||||||||||||||||||||||||||||||||||||||||||||||||||||||||||||||||
| West Central | 31 | 75 | |||||||||||||||||||||||||||||||||||||||||||||||||||||||||||||||||||||||||||||||||||||||||||||||||
| Southeast | 31 | 58 | |||||||||||||||||||||||||||||||||||||||||||||||||||||||||||||||||||||||||||||||||||||||||||||||||
| Southwest | 34 | 51 | |||||||||||||||||||||||||||||||||||||||||||||||||||||||||||||||||||||||||||||||||||||||||||||||||
| Rocky Mountain | 33 | 66 | |||||||||||||||||||||||||||||||||||||||||||||||||||||||||||||||||||||||||||||||||||||||||||||||||
| Pacific | 35 | 83 | |||||||||||||||||||||||||||||||||||||||||||||||||||||||||||||||||||||||||||||||||||||||||||||||||
| Gallup-Healthways Well-Being Index (Millennials); May 4-8, 2016, Values and Beliefs Survey (Legality) | |||||||||||||||||||||||||||||||||||||||||||||||||||||||||||||||||||||||||||||||||||||||||||||||||||
However, regional changes over time in LGBT identification may be affected both by levels of LGBT acceptance and the demographic composition of regional populations. Analyses of Gallup's 2016 Values and Beliefs poll find that the New England and Pacific regions rank highest in LGBT acceptance but differ in the age composition of the population. More than a third of adults in the Pacific region (35%) are millennials, compared with 31% in New England -- figures that, by population demographic standards, represent a relatively large difference. This difference may explain why, despite high levels of social acceptance in both regions, increases in LGBT identity are larger in the Pacific region than in New England.
The presence of large portions of millennials in the population does not perfectly predict the magnitude of increases in LGBT identity. Among regions, the Southwest has a relatively large proportion of millennials in its population (34%) but is also the region least likely to say that gay and lesbian relationships should be legal. This relatively low level of acceptance may be a factor in explaining the relatively low level of change in LGBT identity despite having a large younger population.
Bottom Line
State and regional changes in the level of LGBT identification defy simple explanation. However, it does appear that variation among states and regions in population demographics, especially age, and LGBT social acceptance (or stigma) interact to affect the willingness of adults to identify as LGBT.
| 2015-2016 | Sample size | ||||||||||||||||||||||||||||||||||||||||||||||||||||||||||||||||||||||||||||||||||||||||||||||||||
|---|---|---|---|---|---|---|---|---|---|---|---|---|---|---|---|---|---|---|---|---|---|---|---|---|---|---|---|---|---|---|---|---|---|---|---|---|---|---|---|---|---|---|---|---|---|---|---|---|---|---|---|---|---|---|---|---|---|---|---|---|---|---|---|---|---|---|---|---|---|---|---|---|---|---|---|---|---|---|---|---|---|---|---|---|---|---|---|---|---|---|---|---|---|---|---|---|---|---|---|
| % | |||||||||||||||||||||||||||||||||||||||||||||||||||||||||||||||||||||||||||||||||||||||||||||||||||
| District of Columbia | 8.6 | 1,746 | |||||||||||||||||||||||||||||||||||||||||||||||||||||||||||||||||||||||||||||||||||||||||||||||||
| Vermont | 5.3 | 2,200 | |||||||||||||||||||||||||||||||||||||||||||||||||||||||||||||||||||||||||||||||||||||||||||||||||
| Massachusetts | 4.9 | 15,193 | |||||||||||||||||||||||||||||||||||||||||||||||||||||||||||||||||||||||||||||||||||||||||||||||||
| California | 4.9 | 69,467 | |||||||||||||||||||||||||||||||||||||||||||||||||||||||||||||||||||||||||||||||||||||||||||||||||
| Oregon | 4.9 | 11,859 | |||||||||||||||||||||||||||||||||||||||||||||||||||||||||||||||||||||||||||||||||||||||||||||||||
| Nevada | 4.8 | 5,888 | |||||||||||||||||||||||||||||||||||||||||||||||||||||||||||||||||||||||||||||||||||||||||||||||||
| Delaware | 4.7 | 1,976 | |||||||||||||||||||||||||||||||||||||||||||||||||||||||||||||||||||||||||||||||||||||||||||||||||
| New Hampshire | 4.6 | 3,129 | |||||||||||||||||||||||||||||||||||||||||||||||||||||||||||||||||||||||||||||||||||||||||||||||||
| Washington | 4.6 | 17,782 | |||||||||||||||||||||||||||||||||||||||||||||||||||||||||||||||||||||||||||||||||||||||||||||||||
| New York | 4.5 | 41,203 | |||||||||||||||||||||||||||||||||||||||||||||||||||||||||||||||||||||||||||||||||||||||||||||||||
| Maine | 4.5 | 4,094 | |||||||||||||||||||||||||||||||||||||||||||||||||||||||||||||||||||||||||||||||||||||||||||||||||
| Colorado | 4.3 | 13,844 | |||||||||||||||||||||||||||||||||||||||||||||||||||||||||||||||||||||||||||||||||||||||||||||||||
| Florida | 4.2 | 42,605 | |||||||||||||||||||||||||||||||||||||||||||||||||||||||||||||||||||||||||||||||||||||||||||||||||
| New Mexico | 4.2 | 5,790 | |||||||||||||||||||||||||||||||||||||||||||||||||||||||||||||||||||||||||||||||||||||||||||||||||
| Indiana | 4.1 | 15,642 | |||||||||||||||||||||||||||||||||||||||||||||||||||||||||||||||||||||||||||||||||||||||||||||||||
| Rhode Island | 4.0 | 2,395 | |||||||||||||||||||||||||||||||||||||||||||||||||||||||||||||||||||||||||||||||||||||||||||||||||
| Arizona | 4.0 | 17,402 | |||||||||||||||||||||||||||||||||||||||||||||||||||||||||||||||||||||||||||||||||||||||||||||||||
| Minnesota | 4.0 | 13,176 | |||||||||||||||||||||||||||||||||||||||||||||||||||||||||||||||||||||||||||||||||||||||||||||||||
| Georgia | 4.0 | 20,999 | |||||||||||||||||||||||||||||||||||||||||||||||||||||||||||||||||||||||||||||||||||||||||||||||||
| Illinois | 3.9 | 22,199 | |||||||||||||||||||||||||||||||||||||||||||||||||||||||||||||||||||||||||||||||||||||||||||||||||
| Maryland | 3.9 | 12,532 | |||||||||||||||||||||||||||||||||||||||||||||||||||||||||||||||||||||||||||||||||||||||||||||||||
| Hawaii | 3.8 | 2,121 | |||||||||||||||||||||||||||||||||||||||||||||||||||||||||||||||||||||||||||||||||||||||||||||||||
| Michigan | 3.8 | 19,860 | |||||||||||||||||||||||||||||||||||||||||||||||||||||||||||||||||||||||||||||||||||||||||||||||||
| Ohio | 3.8 | 25,535 | |||||||||||||||||||||||||||||||||||||||||||||||||||||||||||||||||||||||||||||||||||||||||||||||||
| Louisiana | 3.7 | 9,958 | |||||||||||||||||||||||||||||||||||||||||||||||||||||||||||||||||||||||||||||||||||||||||||||||||
| Texas | 3.6 | 53,349 | |||||||||||||||||||||||||||||||||||||||||||||||||||||||||||||||||||||||||||||||||||||||||||||||||
| Pennsylvania | 3.6 | 32,473 | |||||||||||||||||||||||||||||||||||||||||||||||||||||||||||||||||||||||||||||||||||||||||||||||||
| New Jersey | 3.6 | 18,575 | |||||||||||||||||||||||||||||||||||||||||||||||||||||||||||||||||||||||||||||||||||||||||||||||||
| Nebraska | 3.6 | 5,646 | |||||||||||||||||||||||||||||||||||||||||||||||||||||||||||||||||||||||||||||||||||||||||||||||||
| Wyoming | 3.5 | 2,202 | |||||||||||||||||||||||||||||||||||||||||||||||||||||||||||||||||||||||||||||||||||||||||||||||||
| Oklahoma | 3.5 | 10,689 | |||||||||||||||||||||||||||||||||||||||||||||||||||||||||||||||||||||||||||||||||||||||||||||||||
| North Carolina | 3.5 | 23,169 | |||||||||||||||||||||||||||||||||||||||||||||||||||||||||||||||||||||||||||||||||||||||||||||||||
| Connecticut | 3.5 | 7,984 | |||||||||||||||||||||||||||||||||||||||||||||||||||||||||||||||||||||||||||||||||||||||||||||||||
| Virginia | 3.4 | 20,357 | |||||||||||||||||||||||||||||||||||||||||||||||||||||||||||||||||||||||||||||||||||||||||||||||||
| Wisconsin | 3.4 | 14,078 | |||||||||||||||||||||||||||||||||||||||||||||||||||||||||||||||||||||||||||||||||||||||||||||||||
| Missouri | 3.4 | 13,632 | |||||||||||||||||||||||||||||||||||||||||||||||||||||||||||||||||||||||||||||||||||||||||||||||||
| West Virginia | 3.4 | 4,635 | |||||||||||||||||||||||||||||||||||||||||||||||||||||||||||||||||||||||||||||||||||||||||||||||||
| Utah | 3.3 | 8,349 | |||||||||||||||||||||||||||||||||||||||||||||||||||||||||||||||||||||||||||||||||||||||||||||||||
| Kentucky | 3.3 | 10,804 | |||||||||||||||||||||||||||||||||||||||||||||||||||||||||||||||||||||||||||||||||||||||||||||||||
| Iowa | 3.2 | 8,064 | |||||||||||||||||||||||||||||||||||||||||||||||||||||||||||||||||||||||||||||||||||||||||||||||||
| Mississippi | 3.2 | 6,783 | |||||||||||||||||||||||||||||||||||||||||||||||||||||||||||||||||||||||||||||||||||||||||||||||||
| Tennessee | 3.1 | 17,050 | |||||||||||||||||||||||||||||||||||||||||||||||||||||||||||||||||||||||||||||||||||||||||||||||||
| Kansas | 3.1 | 7,024 | |||||||||||||||||||||||||||||||||||||||||||||||||||||||||||||||||||||||||||||||||||||||||||||||||
| Alaska | 3.0 | 2,225 | |||||||||||||||||||||||||||||||||||||||||||||||||||||||||||||||||||||||||||||||||||||||||||||||||
| Alabama | 3.0 | 12,133 | |||||||||||||||||||||||||||||||||||||||||||||||||||||||||||||||||||||||||||||||||||||||||||||||||
| Arkansas | 3.0 | 7,938 | |||||||||||||||||||||||||||||||||||||||||||||||||||||||||||||||||||||||||||||||||||||||||||||||||
| Montana | 3.0 | 4,235 | |||||||||||||||||||||||||||||||||||||||||||||||||||||||||||||||||||||||||||||||||||||||||||||||||
| South Carolina | 3.0 | 11,166 | |||||||||||||||||||||||||||||||||||||||||||||||||||||||||||||||||||||||||||||||||||||||||||||||||
| Idaho | 2.8 | 4,858 | |||||||||||||||||||||||||||||||||||||||||||||||||||||||||||||||||||||||||||||||||||||||||||||||||
| North Dakota | 2.7 | 2,079 | |||||||||||||||||||||||||||||||||||||||||||||||||||||||||||||||||||||||||||||||||||||||||||||||||
| South Dakota | 2.0 | 2,160 | |||||||||||||||||||||||||||||||||||||||||||||||||||||||||||||||||||||||||||||||||||||||||||||||||
| Gallup-Healthways Well-Being Index | |||||||||||||||||||||||||||||||||||||||||||||||||||||||||||||||||||||||||||||||||||||||||||||||||||
Survey Methods
These results of estimates are based on telephone interviews with a random sample of 473,243 U.S. adults, aged 18 and older, living in all 50 states and the District of Columbia, collected from June 1, 2012, through Dec. 30, 2013, and 710,252 adults collected from Jan. 1, 2015, through Dec. 30, 2016, as part of the Gallup Daily tracking survey and the Gallup-Healthways Well-Being Index survey. The data include 14,487 respondents from 2012/2013 and 23,483 from 2015/2016 who said yes when asked, "Do you, personally identify as lesbian, gay, bisexual, or transgender?" The margin of error for each region varies from ±0.1 to ±0.4 percentage points at the 95% confidence level and varies among states from ±0.2 to ±1.6 percentage points, depending on sample size. All reported margins of sampling error include computed design effects for weighting at the state level.
Each sample of national adults includes a minimum quota of 60% cellphone respondents and 40% landline respondents, with additional minimum quotas by time zone within region. Landline and cellular telephone numbers are selected using random-digit-dial methods.
Learn more about how Gallup Daily tracking works.
Learn more about how the Gallup-Healthways Well-Being Index works.