Story Highlights
- Evangelical Hubs and Working Class Country give Trump high marks
- Trump weakest in Big Cities, Urban Suburbs and College Towns
- On shaky ground in blue-collar suburbs
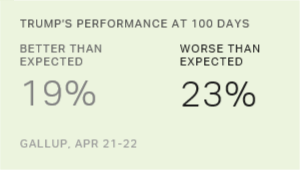
WASHINGTON, D.C. -- Near the 100-day mark of President Donald Trump's presidency, Americans' feelings about Trump are strongly tied to where they live. This suggests the socio-economic fault lines on display in the presidential election still very much divide the political landscape in early 2017.
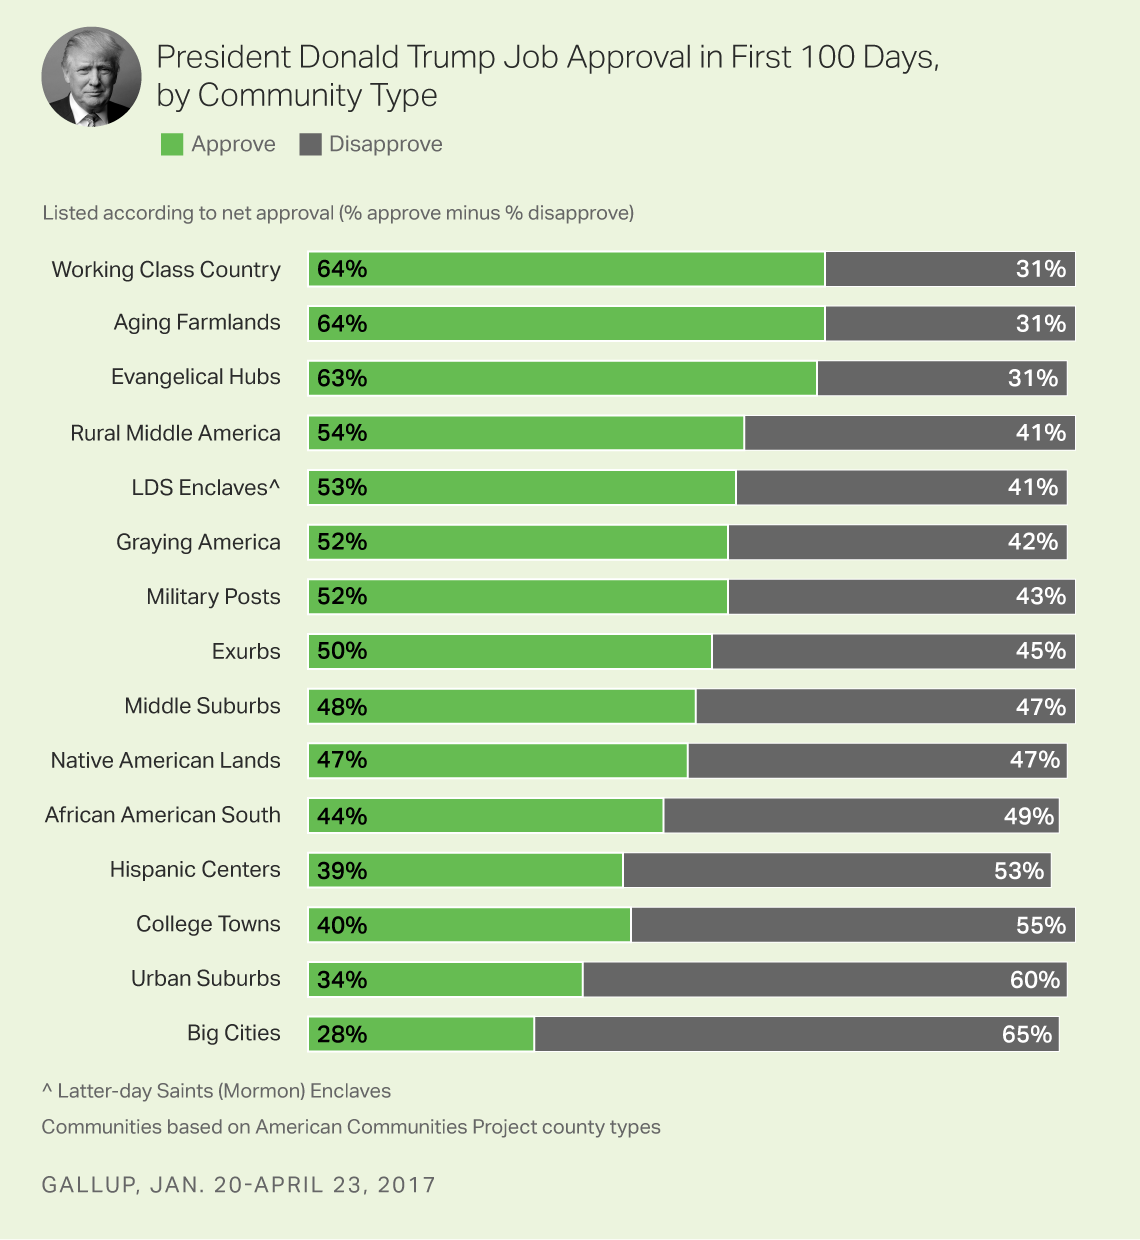
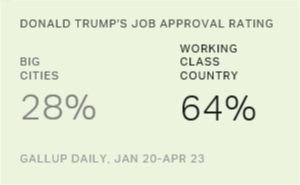
Adults living in rural evangelical and working-class communities give the president high marks, with more than six in 10 approving of his performance. However, in large cities and dense suburban areas, his approval rating is lower than 35%. Meanwhile, people living in less diverse, blue-collar Middle Suburbs are divided in their evaluations of Trump.
The numbers come from an analysis of Gallup tracking data on Trump's job approval performed with the American Communities Project (ACP) at George Washington University. The ACP breaks the nation's 3,100 counties into 15 types using demographic, economic and cultural data. The result is a geographic map of the nation's affinity communities, available here.
The different opinions about Trump are not a surprise; the U.S. has a diverse community landscape. But the sharpness of these differences is notable at such an early point in a presidency.
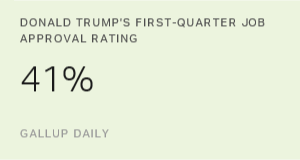
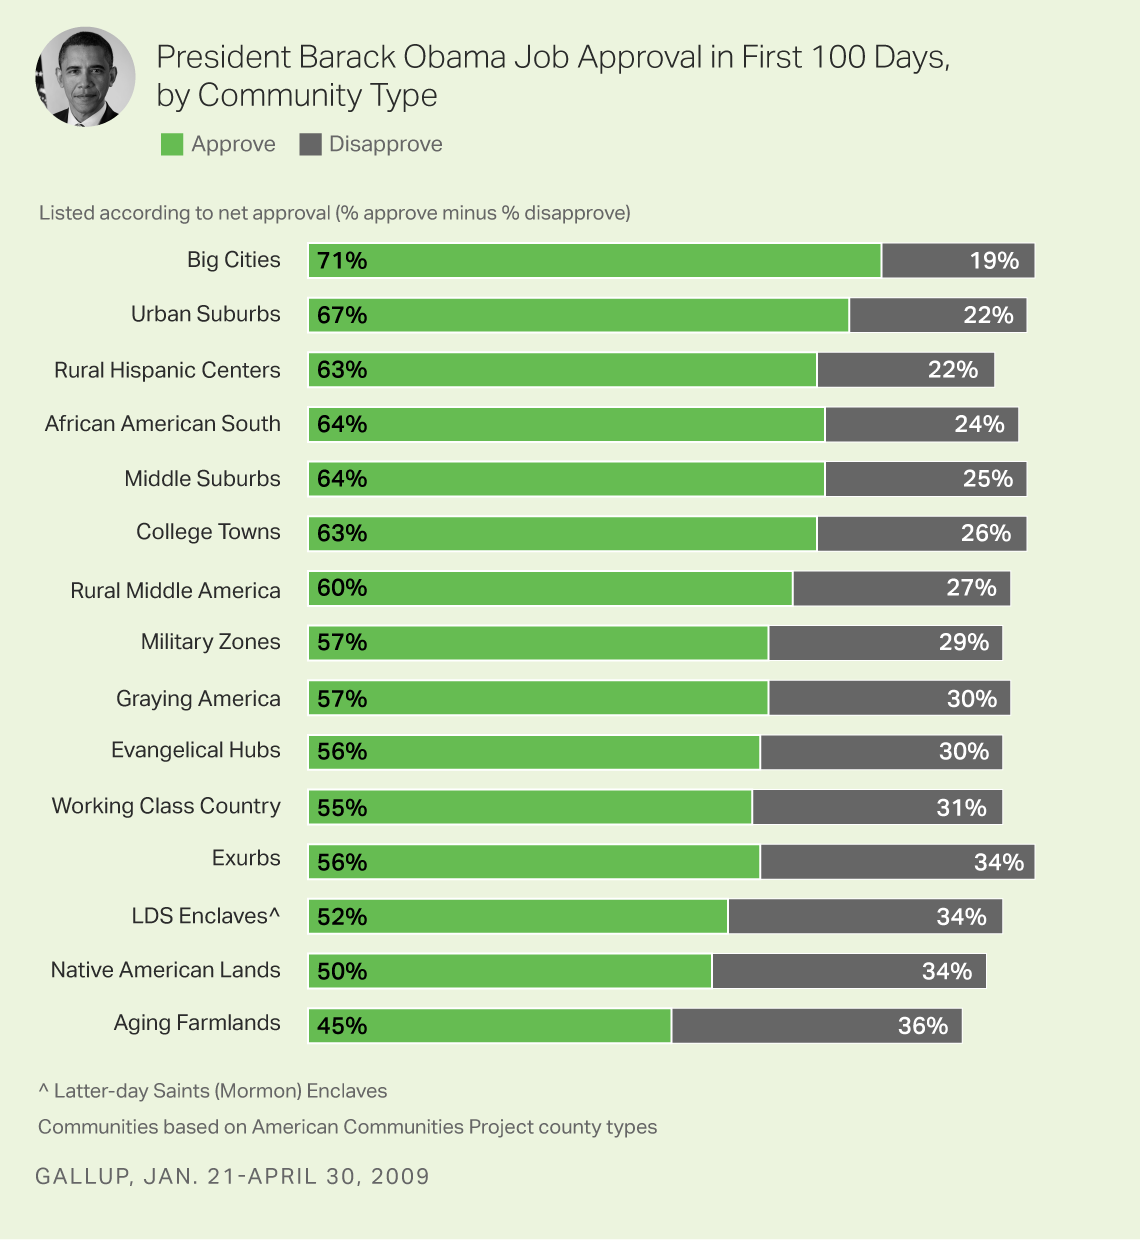
The divisions in Trump's job approval are stark when compared with the beginning of Barack Obama's time in the White House. In the first quarter of Obama's presidency, his approval rating averaged 45% or higher in every community type in the ACP, and those numbers held through the second quarter. The numbers for Obama later split to show sharper divides at the community level, but not to the degree currently seen for Trump until 2012.
Trump's job approval rating displays a much more jagged pattern within the first 100 days of his time in the White House. It speaks to Trump's lack of any sort of political honeymoon since his inauguration. It shows, from the start, how connected attitudes toward the new president are to the different "bubble realities" in which Americans live. Here is a look at some of Trump's peaks and valleys.
Urban Opposition: Big Cities and Suburbs
Across the U.S., only 153 counties fall into the Big Cities and Urban Suburbs categories, but together they account for more than 130 million people. The people residing in these areas strongly disapprove of Trump's job performance -- 65% disapprove in the Big Cities and 60% in the Urban Suburbs. (Twenty-eight percent and 34% approve, respectively, in those communities.) They are also strongly Democratic: Only 24 of these counties voted for Trump in November.
These counties are among the most educated and racially and ethnically diverse places in the U.S. And perhaps just as importantly, they are urban centers where the global economy has been a net plus overall -- lower unemployment and higher incomes abound. Trump's populist arguments about people "left behind" may not have played well here during the campaign because they didn't match the reality on the ground for many people. And the bar for election is higher for Republicans in these communities, as they have a strong Democratic lean. While there is a group in these communities that could be a target for Trump's anti-elitist messaging -- lower-income minorities -- these numbers suggest they are not interested in what the president is offering, at least not yet.
Another community type may be considered in the "opposition" category, the 154 College Town counties. Fifty-five percent of people in those places disapprove of Trump's job performance (40% approve). When combined, the Urban Suburbs, College Towns and Big Cities have the highest percentages of college graduates, showing the education divide in the 2016 exit polls (Hillary Clinton won college graduates by 10 percentage points) still seems to be a powerful voter motivator.
Exurban Transition Point
Trump's approval numbers get a noticeable bump looking at the 222 counties that make up the Exurbs. Fifty percent approve of the president's job performance (and 45% disapprove) in these less densely populated, less diverse counties located mostly around major metropolitan areas. These are places where the U.S. transitions into a more rural landscape.
The Exurbs are also doing well economically, with an unemployment rate more than a half point below the national figure and a college-education rate above the national average. But these communities have long been reliably Republican -- Clinton won only 28 of these counties. The Republican lean in these communities is one reason why Trump's approval rate may be a concern for him here. Trump is in positive territory overall, but by only five points: 50% approve -- 45% disapprove.
These are the GOP-leaning communities full of economic winners, based on high income and low unemployment, where Trump's populist rhetoric may be causing concern. They also tend to be more socially moderate than other Republican communities, with lower church attendance rates -- meaning any social conservative messaging out of the White House may have less of an effect here.
Rural Social Conservative Strength
Three community groups -- Evangelical Hubs, Working Class Country and Aging Farmlands -- make up Trump's base. His approval is above 60% in all of them. This is why the electoral maps look so red -- these communities take up a lot of space. There are 871 of these counties, but they only hold about 22 million people. These are places far away from the big metro areas with above-average income. Working Class Country counties are based heavily in Appalachian coal country. The Aging Farmlands of the Great Plains are some of the most sparsely populated places in the country. The Evangelical Hubs generally occupy the rural South. On the whole, these communities are strongly socially conservative -- in each, more than 73% of residents say religion is important to them, compared with 64% nationally.
Rural social conservative communities are also in the wheelhouse for Trump's economic messaging. They are below the national figure in their average median household income and sit far under the national figure in their percentage of college graduates, all at 19% of their population or less. The national figure is about 30%. These rural communities are also some of the least diverse places in the U.S., being 84% or more non-Hispanic white.
Large parts of the U.S. may have issues with Trump's first 100 days in office, but voters in these communities see a lot to like in his combative approach to Washington elites and the media.
The Uncertain Blue-Collar Burbs: Middle Suburbs
One could argue that Trump won the White House because of the vote in Middle Suburb communities. These 77 largely aging, less-diverse counties located near cities in the upper Midwest swung heavily to him in November. In 2012, Republican Mitt Romney won Middle Suburb communities by about two percentage points. In November, Trump won them by more than 13 points. But the Gallup numbers suggest so far they are unsure about the president: 48% approve of his performance while 47% disapprove.
The Middle Suburbs can challenge any politician, as their population is likely feeling some economic pressure. Their average median household income, about $52,000, is close to the national figure, but it has dropped since 2000, when it was $55,000 -- and that is before adjusting for inflation. The unemployment rate in these communities is a half point over the national average. These are places that have seen better days, and not long ago.
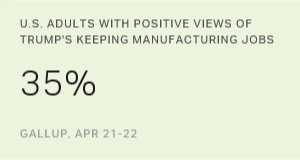
Many of these communities have also seen manufacturing jobs disappear. Promises to bring back jobs appeal to people in the Middle Suburbs, likely explaining one reason why Trump did so well in these places. But they are also anxious for change and leery of whether those promises will be fulfilled, which may be hurting Trump. And letdowns on some of his campaign promises likely didn't help him, such as his reversal on labeling China a currency manipulator and his inability to repeal and replace the Affordable Care Act.
Bottom Line
This is just a selection of the bubble realities that are defining America. Military Post communities bring their own unique set of issues and concerns to the table, as do the Hispanic Centers in the southwest. A new commitment of military troops to some foreign locale or start of construction on the president's proposed Mexican border wall could move the numbers in those communities.
But the larger point in this analysis of Trump's 100-day approval numbers is that the country is not united on much right now. Trump's unique presidency and the mix of demographics and circumstances that define the communities in the ACP emphasize how remarkably fragmented the U.S. is in 2017.
Survey Methods
This analysis is based on telephone interviews conducted Jan. 20-April 23, 2017, on the Gallup U.S. Daily survey, with a random sample of 47,149 adults, aged 18 and older, living in all 50 U.S. states and the District of Columbia. The sample size of the American Community Project community groups exceeds 1,300 for all groups except for LDS Enclaves (577 interviews), Aging Farmlands (123) and Native American Lands (92).
For groups with 1,300 or more interviews, the margin of sampling error is no greater than ±3 percentage points at the 95% confidence level. The margin of sampling error for LDS Enclaves is ±5 percentage points at the 95% confidence level, while results for Aging Farmlands and Native American Lands should be viewed as suggestive only because of the small sample sizes and higher associated margins of error.
Each sample of national adults includes a minimum quota of 70% cellphone respondents and 30% landline respondents, with additional minimum quotas by time zone within region. Landline and cellular telephone numbers are selected using random-digit-dial methods.
Learn more about how the Gallup U.S. Daily works.