GALLUP NEWS SERVICE
PRINCETON, NJ -- Gallup's annual Governance Poll monitors Americans' basic trust and confidence in government, both in the federal government's ability to handle international and domestic matters and in the three branches of the federal government. This year's poll finds a slight decline in trust in the government's ability to handle international affairs, with little change in regards to domestic problems. And while trust in the judicial branch is holding steady, Americans report less trust in the executive and legislative branches than last year. With the exception of the judicial branch, Americans' reported trust is at or near the lows for what Gallup has measured over the past decade. Still, a majority of Americans express trust in all but the executive branch.
The Sep. 7-10 poll updated Gallup's basic trend question on trust in government, asked three times in the 1970s and on a regular basis since 1997.
Domestic and International Matters
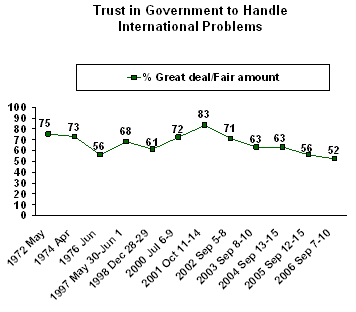
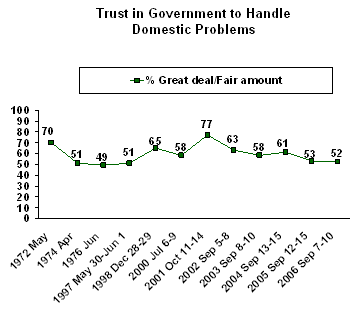
In this year's poll, Americans have the same amount of trust and confidence in the federal government to handle both "domestic" and "international problems" -- 52% say they have "a great deal" or "a fair amount" of trust for each issue area. That parity is a departure from the norm -- Americans' typically have more trust in the federal government to handle international than domestic matters.
Last year at about this time, 56% of Americans expressed trust in the government to handle international problems, continuing a decline from a record-high 83% shortly after the 9/11 terrorist attacks. The current 52% level of trust in the government on foreign matters is the lowest single measurement Gallup has found, although statistically indistinguishable from a 53% reading in May 2000.
The public's trust in the government to handle domestic matters has held steady over the past year -- it was 53% last September -- but is also on the low end of what Gallup has measured historically. In 1976, trust on domestic matters dipped below the majority level to 49%. In recent years, the lowest reading was 51% in 1997. The recent high, 77%, also occurred shortly after the 9/11 terror attacks.
The Three Branches of Government
For the first time in the past decade, trust in the executive branch has dropped below 50%. Currently, 46% of Americans say they have a great deal or fair amount of trust and confidence in the executive branch, down six percentage points from last year. The only other time Gallup found a lower level of trust in the executive branch was in April 1974, a few months before Richard Nixon resigned the presidency during the Watergate scandal.
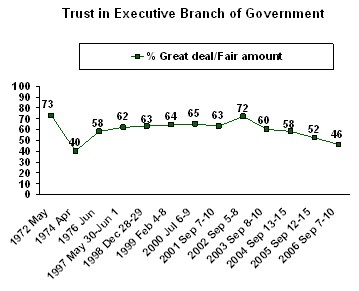
The decline in trust coincides with generally low approval ratings for President Bush. In the poll, just 39% of Americans approved of the way he was doing his job as president, though a subsequent measure showed a more positive evaluation (44% approval) of Bush.
Likewise, trust in the legislative branch has declined to 56% from a 62% reading last year. The current reading is about the same as what Gallup found in 1997 (54%), the lowest single measurement.
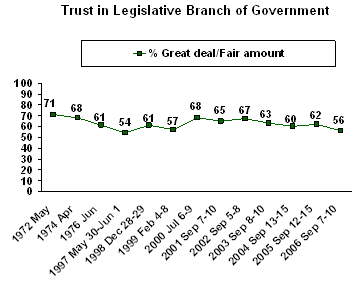
However, it is important to point out that Gallup did not measure trust in Congress in the early 1990s when its job approval ratings were at their lowest. Currently, Congress' approval ratings are low (29%), but are still better than in the early 1990s when they dropped to as low as 18%.
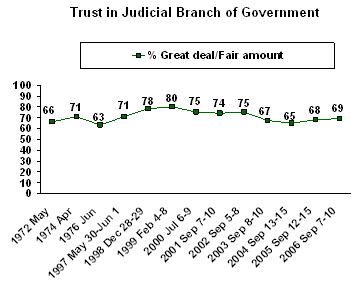
Of the three branches, Americans usually express the greatest trust in the judicial branch. This year, 69% say they have at least a fair amount of trust in the federal judiciary, little changed from the past several years. Over the last decade, a still-positive 65% rating in 2004 ranks as the lowest for the judicial branch, although historically trust was lower in 1976 at 63%.
Partisan Variations in Trust
Political partisanship greatly influences one's expressed level of trust in the government, with the possible exception of the legislative branch. Republicans express more trust across the five issue areas and branches than Democrats, likely because Republicans hold the White House and Congress. This pattern has been evident since Bush took office in 2001. Even in the poll conducted a month after 9/11, there were partisan differences, though not as large as those seen since then.
|
Trust in Government by Party Affiliation, September 2006 Gallup Poll |
||||
|
Overall |
Democrat |
Independent |
Republican |
|
|
% |
% |
% |
% |
|
|
International |
52 |
38 |
40 |
83 |
|
Domestic |
52 |
38 |
42 |
77 |
|
Executive |
46 |
18 |
39 |
87 |
|
Legislative |
56 |
55 |
47 |
67 |
|
Judicial |
69 |
58 |
68 |
84 |
There are wide gaps in expressed trust between self-identified Republicans and Democrats in regards to the federal government's ability to handle international problems (45 percentage points) and domestic problems (39 points). There is an even greater divide of 69 points on trust in the executive branch, which mirrors the polarized approval ratings Democrats and Republicans give Bush. Only 12 points separate the partisans on their ratings of the legislative branch, even though Republicans have control of both houses of Congress.
Partisan gaps were also evident in the Clinton administration, with Democrats consistently expressing more trust than Republicans in the executive branch and the federal government's ability to handle domestic and international problems. Republicans expressed more confidence in the legislative branch, which was in Republican hands at the time. The results from the 1997 poll are typical of those found during the Clinton years.
|
Trust in Government by Party Affiliation, May-June 1997 Gallup Poll |
||||
|
Overall |
Democrat |
Independent |
Republican |
|
|
International |
68 |
75 |
62 |
67 |
|
Domestic |
51 |
62 |
46 |
44 |
|
Executive |
62 |
81 |
61 |
41 |
|
Legislative |
54 |
54 |
46 |
62 |
|
Judicial |
71 |
74 |
67 |
72 |
Survey Methods
These results are based on telephone interviews with a randomly selected national sample of 1,002 adults, aged 18 and older, conducted Sep. 7-10, 2006. For results based on this sample, one can say with 95% confidence that the maximum error attributable to sampling and other random effects is ±3 percentage points. In addition to sampling error, question wording and practical difficulties in conducting surveys can introduce error or bias into the findings of public opinion polls.
13. Now I'd like to ask you several questions about our governmental system. First, how much trust and confidence do you have in our federal government in Washington when it comes to handling [Read A-B] -- a great deal, a fair amount, not very much, or none at all?
A. International Problems
|
Great deal |
Fair amount |
Not very much |
None at all |
No opinion |
|
|
% |
% |
% |
% |
% |
|
|
2006 Sep 7-10 |
13 |
39 |
33 |
14 |
1 |
|
2006 Feb 6-9 |
10 |
49 |
31 |
8 |
2 |
|
2005 Sep 12-15 |
14 |
42 |
33 |
11 |
* |
|
2005 Feb 7-10 |
14 |
48 |
31 |
7 |
* |
|
2004 Sep 13-15 |
18 |
45 |
28 |
8 |
1 |
|
2004 Feb 9-12 |
14 |
48 |
29 |
9 |
* |
|
2003 Sep 8-10 |
16 |
47 |
27 |
9 |
1 |
|
2003 Jul 18-20 |
17 |
52 |
25 |
5 |
1 |
|
2003 Feb 3-6 |
17 |
56 |
20 |
6 |
1 |
|
2002 Sep 5-8 |
18 |
53 |
22 |
6 |
1 |
|
2002 Jun 17-19 |
21 |
54 |
18 |
6 |
1 |
|
2002 Feb 4-6 |
21 |
60 |
14 |
4 |
1 |
|
2001 Oct 11-14 |
36 |
47 |
13 |
3 |
1 |
|
2001 Sep 7-10 |
14 |
54 |
25 |
6 |
1 |
|
2001 Feb 1-4 |
12 |
63 |
19 |
4 |
2 |
|
2000 Jul 6-9 |
17 |
55 |
21 |
6 |
1 |
|
2000 May 18-21 |
8 |
45 |
34 |
12 |
1 |
|
1998 Dec 28-29 |
9 |
52 |
30 |
7 |
2 |
|
1997 May 30-Jun 1 |
10 |
58 |
23 |
7 |
2 |
|
1976 Jun |
8 |
48 |
33 |
7 |
4 |
|
1974 Apr |
24 |
49 |
18 |
4 |
3 |
|
1972 May |
20 |
55 |
20 |
2 |
4 |
|
* = Less than 0.5% |
|||||
B. Domestic Problems
|
Great deal |
Fair amount |
Not very much |
None at all |
No opinion |
|
|
% |
% |
% |
% |
% |
|
|
2006 Sep 7-10 |
8 |
44 |
34 |
13 |
1 |
|
2006 Feb 6-9 |
8 |
45 |
36 |
10 |
1 |
|
2005 Sep 12-15 |
10 |
43 |
35 |
11 |
1 |
|
2005 Feb 7-10 |
9 |
47 |
35 |
8 |
1 |
|
2004 Sep 13-15 |
13 |
48 |
31 |
7 |
1 |
|
2004 Feb 9-12 |
9 |
50 |
30 |
10 |
1 |
|
2003 Sep 8-10 |
9 |
49 |
32 |
9 |
1 |
|
2003 Jul 18-20 |
14 |
50 |
29 |
7 |
* |
|
2003 Feb 3-6 |
11 |
52 |
28 |
7 |
2 |
|
2002 Sep 5-8 |
11 |
52 |
28 |
7 |
2 |
|
2002 Jun 17-19 |
13 |
54 |
23 |
8 |
2 |
|
2002 Feb 4-6 |
12 |
59 |
23 |
5 |
1 |
|
2001 Oct 11-14 |
24 |
53 |
17 |
4 |
2 |
|
2001 Sep 7-10 |
6 |
54 |
31 |
8 |
1 |
|
2001 Feb 1-4 |
7 |
56 |
28 |
8 |
1 |
|
2000 Jul 6-9 |
10 |
48 |
30 |
10 |
2 |
|
2000 May 18-21 |
11 |
54 |
26 |
7 |
2 |
|
1998 Dec 28-29 |
11 |
54 |
26 |
7 |
2 |
|
1997 May 30-Jun 1 |
6 |
45 |
36 |
11 |
2 |
|
1976 Jun |
5 |
44 |
42 |
7 |
3 |
|
1974 Apr |
9 |
42 |
36 |
8 |
4 |
|
1972 May |
11 |
59 |
26 |
3 |
2 |
|
* = Less than 0.5% |
|||||
14. As you know, our federal government is made up of three branches: an Executive branch, headed by the President: a Judicial branch, headed by the U.S. Supreme Court: and a Legislative branch, made up of the U.S. Senate and House of Representatives. First, let me ask you how much trust and confidence you have at this time in the Executive branch headed by the President, the Judicial branch headed by the US Supreme Court, and the Legislative branch, consisting of the U.S. Senate and House of Representatives -- a great deal, a fair amount, not very much, or none at all?
A. The Executive branch headed by the President
|
Great deal |
Fair amount |
Not very much |
None at all |
No opinion |
|
|
% |
% |
% |
% |
% |
|
|
2006 Sep 7-10 |
15 |
31 |
28 |
24 |
1 |
|
2005 Sep 12-15 |
19 |
33 |
30 |
18 |
* |
|
2004 Sep 13-15 |
31 |
27 |
25 |
16 |
1 |
|
2003 Sep 8-10 |
25 |
35 |
26 |
14 |
* |
|
2002 Sep 5-8 |
28 |
44 |
20 |
7 |
1 |
|
2001 Sep 7-10 |
21 |
42 |
28 |
8 |
1 |
|
2000 Jul 6-9 |
18 |
47 |
23 |
11 |
1 |
|
1999 Feb 4-8 |
21 |
43 |
24 |
11 |
1 |
|
1998 Dec 28-29 |
24 |
39 |
23 |
12 |
2 |
|
1997 May 30-Jun 1 |
13 |
49 |
27 |
9 |
2 |
|
1976 Jun |
13 |
45 |
30 |
9 |
4 |
|
1974 Apr |
12 |
28 |
36 |
20 |
3 |
|
1972 May |
24 |
49 |
20 |
4 |
2 |
|
* = Less than 0.5% |
|||||
B. The Judicial branch, headed by the U.S. Supreme Court
|
Great deal |
Fair amount |
Not very much |
None at all |
No opinion |
|
|
% |
% |
% |
% |
% |
|
|
2006 Sep 7-10 |
15 |
54 |
21 |
7 |
3 |
|
2005 Sep 12-15 |
13 |
55 |
25 |
6 |
1 |
|
2004 Sep 13-15 |
14 |
51 |
27 |
6 |
2 |
|
2003 Sep 8-10 |
13 |
54 |
27 |
5 |
1 |
|
2002 Sep 5-8 |
17 |
58 |
18 |
5 |
2 |
|
2001 Sep 7-10 |
17 |
57 |
20 |
4 |
2 |
|
2000 Jul 6-9 |
23 |
52 |
18 |
6 |
1 |
|
1999 Feb 4-8 |
29 |
51 |
13 |
5 |
2 |
|
1998 Dec 28-29 |
27 |
51 |
16 |
4 |
2 |
|
1997 May 30-Jun 1 |
19 |
52 |
22 |
5 |
2 |
|
1976 Jun |
16 |
47 |
26 |
6 |
4 |
|
1974 Apr |
17 |
54 |
20 |
5 |
5 |
|
1972 May |
17 |
49 |
24 |
7 |
4 |
C. The Legislative branch, consisting of the U.S. Senate and House of Representatives
|
Great deal |
Fair amount |
Not very much |
None at all |
No opinion |
|
|
% |
% |
% |
% |
% |
|
|
2006 Sep 7-10 |
6 |
50 |
31 |
10 |
2 |
|
2005 Sep 12-15 |
8 |
54 |
31 |
6 |
1 |
|
2004 Sep 13-15 |
7 |
53 |
33 |
6 |
1 |
|
2003 Sep 8-10 |
8 |
55 |
31 |
5 |
1 |
|
2002 Sep 5-8 |
9 |
58 |
26 |
6 |
1 |
|
2001 Sep 7-10 |
7 |
58 |
28 |
6 |
1 |
|
2000 Jul 6-9 |
11 |
57 |
24 |
7 |
1 |
|
1999 Feb 4-8 |
8 |
49 |
34 |
7 |
2 |
|
1998 Dec 28-29 |
13 |
48 |
30 |
7 |
2 |
|
1997 May 30-Jun 1 |
6 |
48 |
36 |
8 |
2 |
|
1976 Jun |
9 |
52 |
31 |
6 |
4 |
|
1974 Apr |
13 |
55 |
24 |
4 |
4 |
|
1972 May |
13 |
58 |
22 |
3 |
3 |