GALLUP NEWS SERVICE
PRINCETON, NJ -- The death penalty -- ruled unconstitutional by the U.S. Supreme Court in 1972 -- is now the law of the land in 38 states, and has been administered more than 1,000 times since the Supreme Court reinstated it in 1976. It will now be sought against the two men charged in the horrific murders last week of a Connecticut mother and her two daughters during a home invasion.
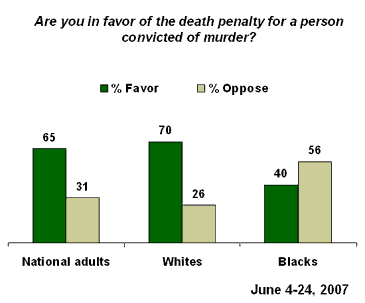
According to Gallup's latest update on public support for the death penalty, 65% favor it as the penalty for someone convicted of murder, while 31% oppose it. This is based on Gallup's annual Minority Rights and Relations survey, conducted June 4-24, 2007.
The poll finds generally broad public agreement on the subject, with a majority of men, women, Republicans, Democrats, and adults of different age groups supporting it. There are significant differences in the degree of support among some of these groups, especially between Republicans and Democrats; however, in each case, more still favor than oppose it.
The most notable distinction is between whites and blacks because a majority of whites (70%) favor capital punishment, while a majority of blacks (56%) oppose it.

Majorities of Whites and Blacks Have Occasionally Agreed on the Issue
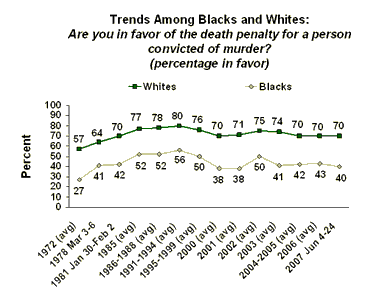
Gallup's long-term polling on public support for the death penalty shows that white-black disagreement on the issue, an often-reported-on schism, has in fact varied over the years. Gallup trends since 1972 show a consistent racial gap in the percentage favoring the death penalty for murder, with whites significantly more supportive than blacks. However, the trend documents fluctuations in public support for the death penalty over the years; these have occurred among both races.
In a March 1972 poll, 50% of Americans favored the death penalty, including only a slim majority of whites (53%) and about one-quarter of blacks (23%). This was during a period of doubt about capital punishment shortly before the Supreme Court's decision in Furman v. Georgia, in which it determined the Georgia and Texas death penalty statutes violated the 8th and 14th Amendments' protections against cruel and unusual punishment.
Public support for capital punishment gradually rose to 72% in 1985, and between then and 1999, a majority of blacks said they favored it for murder; whites, of course, favored it by an even higher margin. Interestingly, nothing in the sequence of major events in the Oklahoma City bombing, which resulted in the execution of Timothy McVeigh -- not the bombing on April 19, 1995; his sentencing in June 1997; or his execution in June 2001 -- appears to have shifted public views on the death penalty in either direction.
In January 2000, then-Gov. George Ryan of Illinois, a death penalty supporter, issued an immediate moratorium in his state because of the high number of cases in which those on death row were ultimately proved to be not guilty of the crimes for which they were convicted. This event appears to have had some effect on public attitudes, as the overall percentage supporting the death penalty fell from an average of 71% in 1999 to 66% in February and June 2000. The decline was seen about equally among whites as well as blacks.
Public support (among both whites and blacks) then expanded in 2002 (perhaps a delayed reaction to the 9/11 bombings, though this is unclear), and has since fallen back below a majority among blacks and to 70% among whites, where it remains today.
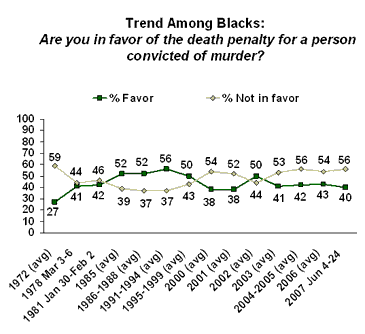
In order to ensure large enough sample sizes of blacks for statistical reliability, these findings, detailed in the accompanying graph, are based on averages across multiple surveys for periods of similar attitudes.

That a majority of blacks have occasionally favored the death penalty is most apparent in the accompanying graph detailing their average levels of support and opposition since 1972.

Bottom Line
For at least 35 years, Gallup polling has found whites to be more supportive than blacks of the death penalty, by about a 30-point margin. However, overall public support has waxed and waned, and this has occurred in about equal measure in both racial groups. General public support has occasionally risen to the point that a majority of blacks have supported the death penalty for murder. At no time has Gallup found support dropping so low that a majority of whites have opposed it.
Survey Methods
The latest results are based on telephone interviews with 2,388 adults nationwide, aged 18 and older, conducted June 4-24, 2007, including oversamples of blacks and Hispanics that are weighted to reflect their proportions in the general population. For results based on the total sample of national adults, one can say with 95% confidence that the maximum margin of sampling error is ±5 percentage points. For results based on the sample of 802 blacks, the maximum margin of sampling error is ±6 percentage points. For results based on the sample of 1,302 whites, the maximum margin of sampling error is ±6 percentage points.
In addition to sampling error, question wording and practical difficulties in conducting surveys can introduce error or bias into the findings of public opinion polls.
|
Summary Trend Based on Averages
|
|||||||
|
|
National
|
Whites |
Blacks |
||||
|
|
Favor |
Not in
|
Favor |
Not in
|
Favor |
Not in
|
(n) |
|
% |
% |
% |
% |
% |
% |
|
|
|
1972 (avg) |
54 |
37 |
57 |
34 |
27 |
59 |
280 |
|
1978 Mar 3-6 |
62 |
27 |
64 |
26 |
41 |
44 |
154 |
|
1981 Jan 30-Feb 2 |
66 |
25 |
70 |
22 |
42 |
46 |
162 |
|
1985 (avg) |
74 |
19 |
77 |
17 |
52 |
39 |
247 |
|
1986/1988 (avg) |
75 |
19 |
78 |
17 |
52 |
37 |
215 |
|
1991/1994 (avg) |
78 |
17 |
80 |
15 |
56 |
37 |
376 |
|
1995/1999 (avg) |
72 |
22 |
76 |
19 |
50 |
43 |
842 |
|
2000 (avg) |
66 |
27 |
70 |
24 |
38 |
54 |
263 |
|
2001 (avg) |
67 |
26 |
71 |
22 |
38 |
52 |
144 |
|
2002 (avg) |
71 |
25 |
75 |
22 |
50 |
44 |
105 |
|
2003 (avg) |
69 |
28 |
74 |
24 |
41 |
53 |
196 |
|
2004/2005 (avg) |
66 |
29 |
70 |
26 |
42 |
56 |
184 |
|
2006 (avg) |
66 |
28 |
70 |
25 |
43 |
54 |
96 |
|
2007 |
65 |
31 |
70 |
26 |
40 |
56 |
802 |
