GALLUP NEWS SERVICE
PRINCETON, NJ -- On average, Americans appear more worried about retirement than about any other financial problem. According to a Gallup Poll conducted April 7-9, 54% of Americans say they are either very or somewhat worried about having enough money for retirement. That is the largest percentage of "worry" answers among seven items mentioned -- including paying medical costs, maintaining their current standard of living, and paying credit card bills.
Among people who are not yet retired, the percentage expressing worry about retirement is even higher, at 60%. And among non-retired people age 50 and older, those who are closest to retirement age, almost two-thirds (65%) say they are worried.
Worry is highly related to expectations about having enough money to live comfortably in retirement. Overall, 59% of non-retired Americans expect they will have enough money to live comfortably in retirement. Just over a third, 36%, think they will not have enough money to live comfortably.
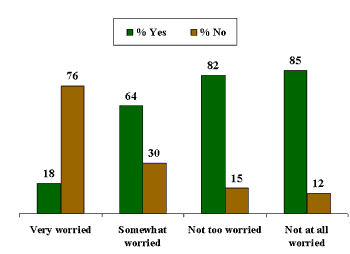
| Likely to Have Enough Money to Live Comfortably in Retirement? Compared by How Worried People are About Retirement |
 |
| Apr 7-9, 2003 |
Only a few people who say they are "very" worried about retirement hold optimistic expectations. Note that just 18% of this group expect to have enough money in retirement. The percentage jumps to 64% among those who are "somewhat" worried, and to over 80% among those who are "not too" or "not at all" worried.
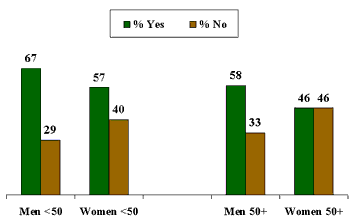
Expectations about having enough money are also highly related to both age and gender. Men are more optimistic than women, and younger people are more optimistic than their elders, that they will have enough money in retirement.
| Likely to Have Enough Money to Live Comfortably in Retirement? Compared by Gender and Age |
 |
| Apr 7-9, 2003 |
Men are about 10 to 12 percentage points more likely than are women in comparable age categories to say they will have enough money. Similarly, young men are more likely than older men, and young women more than older women, to express optimism about having enough money in retirement.
Sources of Retirement Income
The poll finds that more people, 86%, expect to rely on Social Security as either a major or minor source of income than on any other type of income. Eighty-one percent also mention a 401(k) or similar type of retirement savings account as a major or minor source of retirement income.
EXPECTED RETIREMENT INCOME SOURCES
|
2003 Apr 7-9 |
Major source |
Minor source |
Not a source |
|
% |
% |
% |
|
|
A 401(k), IRA, Keogh or other retirement savings account |
47 |
34 |
17 |
|
Social Security |
29 |
57 |
12 |
|
A work sponsored pension plan |
28 |
32 |
39 |
|
The equity you have built up in your home |
25 |
42 |
30 |
|
Individual stock or stock mutual fund investments |
20 |
42 |
36 |
|
Other savings such as a regular savings account or CDs |
19 |
52 |
27 |
|
Part time work |
13 |
57 |
29 |
|
Annuities or insurance plans |
10 |
36 |
53 |
|
Money from an inheritance |
7 |
31 |
60 |
|
Rent and royalties |
5 |
27 |
66 |
Despite the slightly higher overall reliance on Social Security, Americans are much more likely (47%) to cite 401(k)-type investments as a "major" source of retirement income than Social Security (29%).
Still, the percentage relying on 401(k)s is down from what it was two years ago, when the stock market was considerably higher. At that time, 58% of non-retired Americans said 401(k)s would be a "major" source of retirement income, compared with 53% who said that last year.
The poll also shows that about seven in 10 people expect to work part-time after they are retired. Thirteen percent say that work will be a major source of their retirement income, while 57% say it will be only a minor source. Another 29% say it will not be a source of income at all.
Many Americans also expect to rely on a work-sponsored pension plan, equity in their home, stock investments, and other savings.
Age of Retirement
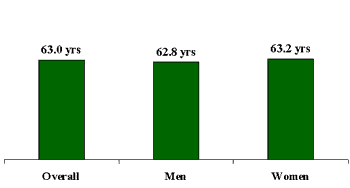
People who are not yet retired expect, on average, to retire at age 63.0. That is up slightly from the mid-1990s, when the average expectation was to retire at age 60.0. The current figure varies somewhat by age and gender, and by how worried people are about having enough money for retirement.
Men expect to retire earlier (average age of 62.8 years) than women (63.2 years) by about half a year.
| Expected Age to Retire: by Gender |
 |
| Apr 7-9, 2003 |
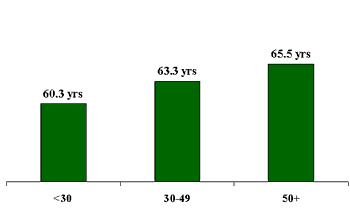
Not surprisingly, younger people are more optimistic about retiring than are older people. The difference between those under 30 (who expect to retire at 60.3 years) and those 50 and older (65.5 years) is just over five years.
| Expected Age to Retire: by Age |
 |
| Apr 7-9, 2003 |
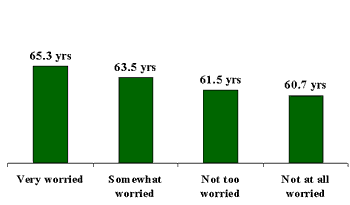
There is about a four and a half year difference in the projected retirement age between those who are very worried (65.3 years), and those who are not at all worried (60.7 years), about having enough income in retirement.
| Expected Age to Retire by How Worried People are About Having Enough Money at Retirement |
 |
| Apr 7-9, 2003 |
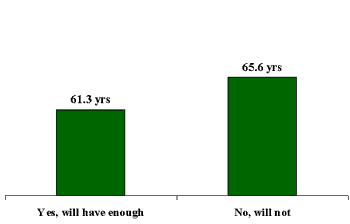
There is a similar difference between those who say they will have enough money to live comfortably (61.3 years) and those who say they will not have enough (65.6 years).
| Expected Age to Retire by Whether People Expect to Have Enough Retirement Income to Live Comfortably |
 |
| Apr 7-9, 2003 |
Survey Methods
Results are based on telephone interviews with 1,018 national adults, aged 18+, conducted April 7-9, 2003. For results based on the total sample of national adults, one can say with 95% confidence that the maximum margin of sampling error is ±3 percentage points. In addition to sampling error, question wording and practical difficulties in conducting surveys can introduce error or bias into the findings of public opinion polls.
When you retire, do you think you will have enough money to live comfortably, or not?
BASED ON --811-- NON-RETIRED ADULTS
|
Yes |
No |
No opinion |
|
|
2003 Apr 7-9 |
59% |
36 |
5 |
|
2002 Apr 8-11 |
59% |
32 |
9 |
When you retire, how much do you expect to rely on each of the following sources of money -- will it be a major source of income, a minor source of income, or not a source at all? How about -- [READ A-J IN ORDER]?
BASED ON --811-- NON-RETIRED ADULTS
A. Social Security
|
Major source |
Minor source |
Not a source |
No opinion |
|
|
2003 Apr 7-9 |
29% |
57 |
12 |
2 |
|
2002 Apr 8-11 |
27% |
56 |
15 |
2 |
|
2001 Apr 6-8 |
28% |
57 |
14 |
1 |
B. A 401(k), IRA, Keogh or other retirement savings account
|
Major source |
Minor source |
Not a source |
No opinion |
|
|
2003 Apr 7-9 |
47% |
34 |
17 |
2 |
|
2002 Apr 8-11 |
53% |
28 |
16 |
3 |
|
2001 Apr 6-8 |
58% |
26 |
15 |
1 |
C. Individual stock or stock mutual fund investments
|
Major source |
Minor source |
Not a source |
No opinion |
|
|
2003 Apr 7-9 |
20% |
42 |
36 |
2 |
|
2002 Apr 8-11 |
23% |
43 |
32 |
2 |
|
2001 Apr 6-8 |
24% |
39 |
36 |
1 |
D. Money from an inheritance
|
Major source |
Minor source |
Not a source |
No opinion |
|
|
2003 Apr 7-9 |
7% |
31 |
60 |
2 |
|
2002 Apr 8-11 |
10% |
28 |
60 |
2 |
|
2001 Apr 6-8 |
7% |
29 |
63 |
1 |
E. Other savings such as a regular savings account or CDs
|
Major source |
Minor source |
Not a source |
No opinion |
|
|
2003 Apr 7-9 |
19% |
52 |
27 |
2 |
|
2002 Apr 8-11 |
23% |
50 |
25 |
2 |
|
2001 Apr 6-8 |
16% |
51 |
32 |
1 |
F. A work sponsored pension plan
|
Major source |
Minor source |
Not a source |
No opinion |
|
|
2003 Apr 7-9 |
28% |
32 |
39 |
1 |
|
2002 Apr 8-11 |
29% |
33 |
36 |
2 |
|
2001 Apr 6-8 |
34% |
28 |
37 |
1 |
G. Rent and royalties
|
Major source |
Minor source |
Not a source |
No opinion |
|
|
2003 Apr 7-9 |
5% |
27 |
66 |
2 |
|
2002 Apr 8-11 |
8% |
29 |
60 |
3 |
|
2001 Apr 6-8 |
5% |
22 |
72 |
1 |
H. Annuities or insurance plans
|
Major source |
Minor source |
Not a source |
No opinion |
|
|
2003 Apr 7-9 |
10% |
36 |
53 |
1 |
|
2002 Apr 8-11 |
7% |
40 |
51 |
2 |
|
2001 Apr 6-8 |
7% |
34 |
58 |
1 |
I. Part time work
|
Major source |
Minor source |
Not a source |
No opinion |
|
|
2003 Apr 7-9 |
13% |
57 |
29 |
1 |
|
2002 Apr 8-11 |
16% |
51 |
31 |
2 |
|
2001 Apr 6-8 |
10% |
52 |
36 |
2 |
J. The equity you have built up in your home
|
Major source |
Minor source |
Not a source |
No opinion |
|
|
2003 Apr 7-9 |
25% |
42 |
30 |
3 |
|
2002 Apr 8-11 |
24% |
40 |
33 |
3 |
SUMMARY TABLE: EXPECTED RETIREMENT INCOME SOURCES
|
2003 Apr 7-9 |
Major source |
Minor source |
Not a source |
|
% |
% |
% |
|
|
A 401(k), IRA, Keogh or other retirement savings account |
47 |
34 |
17 |
|
Social Security |
29 |
57 |
12 |
|
A work sponsored pension plan |
28 |
32 |
39 |
|
The equity you have built up in your home |
25 |
42 |
30 |
|
Individual stock or stock mutual fund investments |
20 |
42 |
36 |
|
Other savings such as a regular savings account or CDs |
19 |
52 |
27 |
|
Part time work |
13 |
57 |
29 |
|
Annuities or insurance plans |
10 |
36 |
53 |
|
Money from an inheritance |
7 |
31 |
60 |
|
Rent and royalties |
5 |
27 |
66 |
At what age do you expect to retire?
BASED ON --811-- NON-RETIRED ADULTS
|
Under 55 |
|
|
|
Over |
Never retire |
No opinion |
|
|
|
2003 Apr 7-9 |
8% |
11 |
23 |
28 |
22 |
-- |
8 |
63 |
|
2002 Apr 8-11 |
7% |
15 |
21 |
26 |
21 |
-- |
10 |
63 |
|
1995 Dec 15-18 |
15% |
12 |
23 |
29 |
15 |
5 |
4 |
60 |
|
1995 Nov 6-8 |
16% |
11 |
20 |
34 |
12 |
3 |
4 |
60 |
