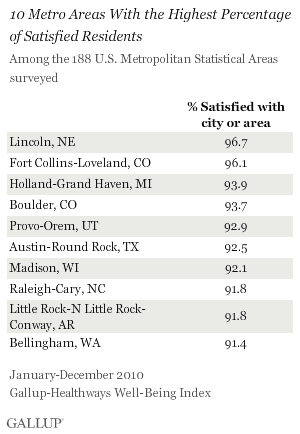
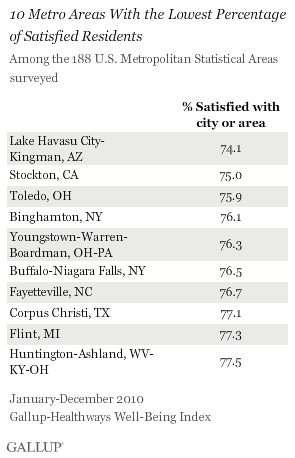
WASHINGTON, D.C. -- Lincoln, Neb., residents are close to unanimous in saying they are satisfied with the city or area where they live, according to 2010 Gallup-Healthways Well-Being Index data -- 96.7% respond this way, the highest proportion across 188 U.S. metropolitan areas. Lincoln is also the metro area with the lowest current unemployment rate in the country, according to the U.S. Bureau of Labor Statistics. At the bottom of the list, about three-fourths of residents in Arizona's Lake Havasu City-Kingman area (74.1%) and in Stockton, Calif., (75%) are satisfied.
The 2010 metro area findings are extracted from Gallup's 2010 Daily tracking data set of more than 200,000 U.S. adults, aged 18 and older. Gallup categorizes U.S. metro areas according to the U.S. Office of Management and Budget's definitions for Metropolitan Statistical Areas (MSAs), and reports on all MSAs for which there are a minimum of 300 interviews available.
Residents' likelihood to be satisfied with their city or area is significantly related to the area's average income level. Household income estimates for 2010 indicate the median figure among the 10 metro areas with the highest percentage of satisfied residents is $71,250 -- significantly higher than the median $55,000 among the 10 metro areas with the lowest percentage of satisfied residents. But a metro area's relative affluence is not a perfect indicator of how satisfied its residents are likely to be. After all, the Little Rock-N Little Rock-Conway, Ark., area, with a median household income of $59,100, is on the "most satisfied" list, while residents of New York's Buffalo-Niagara Falls area, with a median income of $63,700, are among the least likely to be satisfied with their city or area.
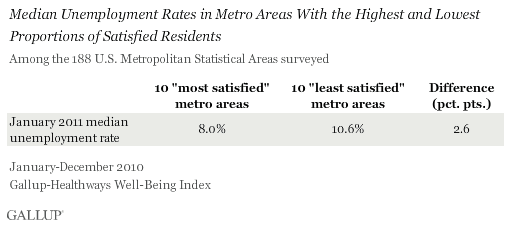
The presence of stable sources of employment is another key factor in satisfaction with one's city. Half of the metro areas on the most satisfied list -- Lincoln; Austin, Texas; Madison, Wis.; Raleigh-Cary, N.C.; and Little Rock-N Little Rock-Conway -- are state capitals with major universities, both factors that help cushion employment rates during tough economic times. Using government figures for January 2011, the median unemployment rate among the 10 metro areas with the highest percentage of satisfied residents was 8.0%, below the national figure of 9.8%. Again, Lincoln's rate was the lowest in the country in January, at 4.1%.
Conversely, several of the metro areas on the "least satisfied" list -- including Toledo, Ohio; Binghamton, N.Y.; Buffalo-Niagara Falls; and Flint, Mich. -- have seen their large manufacturing sectors decline in recent decades and are now working to establish new sources of growth. Among the 10 metro areas with the lowest percentage of satisfied residents, the median unemployment rate is 10.6%. Topping the list is the Lake Havasu City-Kingman area, where the rate is 11.5%.
Stockton, Calif., second on the least satisfied list, was named by Forbes in February 2011 as "America's Most Miserable City" -- the second time in three years the city has earned that dubious distinction. The magazine cites several reasons for Stockton's ranking -- the most prominent being the housing bust, which decimated the area's real estate market. However, Stockton residents are also burdened by long commute times, high crime rates, high income taxes, and high unemployment.
Optimism Among Metro Area Residents
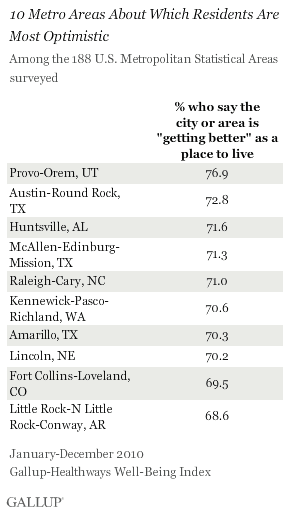
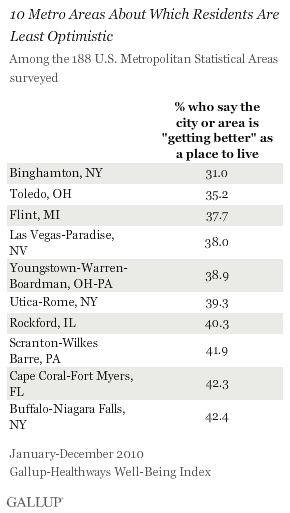
Residents of the metro areas surveyed were also asked whether they think their city or area is getting better or getting worse as a place to live. Among all 188 metro areas, a median 56.4% of residents said things were getting better. These figures spanned a broad range, however, from more than two-thirds of residents in the top 10 "most optimistic" cities to well below half in cities on the "least optimistic" list.
View your state's optimism level.
The differences in the least and most optimistic lists are revealing. Thriving knowledge-based industries support job growth in several of the metro areas with the highest percentage of residents who say their area is getting better as a place to live. In Huntsville, Ala., -- third on the most optimistic list -- technology and engineering research largely drives the local economy. The area's major employers include NASA's Marshall Space Flight Center and Cummings Research Park, the second-largest research and technology park in the country, with 285 companies. The Kennewick-Pasco-Richland area in Washington State also has a large concentration of scientists and engineers and is home to the U.S. Department of Energy's Pacific Northwest National Laboratory. In 2009, Forbes named Kennewick the country's second-best city for new jobs.
The least optimistic cities, on the other hand, are home to some of the weakest economies in the country. Las Vegas' tourism- and construction-based economy was among the hardest hit by the recession. The city's current unemployment rate is 13.7%, and a recent report by the Brookings Institution and the London School of Economics ranked its economic performance as the fifth-worst among 150 major metro areas worldwide. Current unemployment rates in Flint, Mich.; Rockford, Ill.; and Florida's Cape Coral-Fort Myers area all top 12%.
Implications
None of this is to say that economic factors are alone in influencing Americans' satisfaction with their cities. The availability of high-quality education and healthcare services are likely to factor into the equation, as is the city's success in promoting healthy lifestyles and a strong sense of community.
However, cities with healthy economic bases are better able to address these kinds of issues than those that constantly struggle with budget shortfalls. The presence of good jobs means more residents have opportunities to actively contribute to the vitality of their communities, whether through the taxes they pay or the services they provide. It also means residents are less likely to turn to street crime out of desperation, or to move away from the area in search of opportunities elsewhere. So when it comes to boosting residents' satisfaction with their communities, promoting business development and job growth may not be the only consideration -- but it is a natural place to start.
About the Gallup-Healthways Well-Being Index
The Gallup-Healthways Well-Being Index tracks U.S. well-being and provides best-in-class solutions for a healthier world. To learn more, please visit well-beingindex.com.
Survey Methods
Results are based on telephone interviews conducted as part of the Gallup-Healthways Well-Being Index survey Jan. 2-Dec. 29, 2010, with a random sample of 245,817 adults, aged 18 and older, living in reportable metropolitan statistical areas in all 50 U.S. states and the District of Columbia, selected using random-digit-dial sampling.
Metro areas in this article are based on the Metropolitan Statistical Areas (MSAs) as defined by the U.S. Office of Management and Budget. In many cases, more than one city is included in the same MSA. The San Jose, Calif., MSA, for example, also includes the smaller nearby cities of Sunnyvale and Santa Clara in addition to San Jose itself. Each respondent is attributed to his or her MSA based on the self-report of his or her ZIP code. Gallup reports data for MSAs for which there were at least 300 completed interviews in 2010. A total of 188 MSAs met this criterion, which generally incorporates the larger MSAs according to population size.
Maximum expected error ranges for the MSAs vary according to size, ranging from less than 1 percentage point for the largest cities represented to ±6.5 percentage points for the smallest. Interviews are conducted with respondents on landline telephones (for respondents with a landline telephone) and cellular phones (for respondents who are cell phone only and cell phone mostly).
In addition to sampling error, question wording and practical difficulties in conducting surveys can introduce error or bias into the findings of public opinion polls.
For more details on Gallup's polling methodology, visit www.gallup.com.