PRINCETON, NJ -- The Republican Party in 2011 looks similar, demographically and ideologically, to the Republican Party that nominated John McCain in 2008. As a group, Republicans continue to be more likely than average to be male, white, married, and religious, and to describe their political views as "conservative."
These results are based on a special Gallup analysis of the demographic and ideological composition of the U.S. population today (based on Gallup Daily tracking from June through August 2011) versus at the start of 2008 (from January through March, when the GOP presidential nomination was being decided).
For this analysis, the Republican population is defined as those who either identify as Republicans, or who identify as independents but say they lean toward the Republican Party. Thirty-seven percent of Americans identified as or leaned Republican from January-March 2008, and 40% identified as Republicans from June-August 2011.
Detailed below are the major differences between Republicans and the larger U.S. adult population, and changes since 2008.
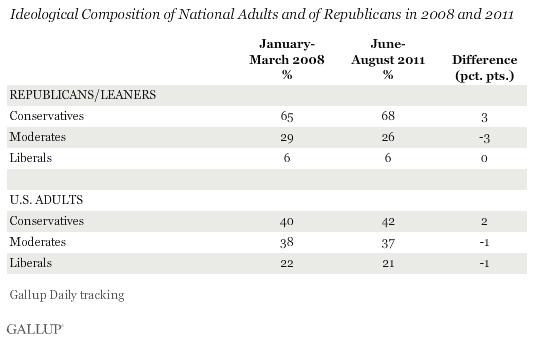
1. Republicans are much more conservative than the national average, as they were in 2008. Yet despite the high profile of conservative Tea Party movement activists within the Republican Party over the past several years, Republicans as a whole are not substantially more conservative now. Over this period, conservative identification has grown by two percentage points among all Americans, and by three points among Republicans.
This doesn't mean, of course, that conservative Republicans are not more active now than they were in 2008. But the overall ideological composition of the GOP has not changed materially -- with roughly two in three Republicans and Republican leaners identifying as politically conservative.
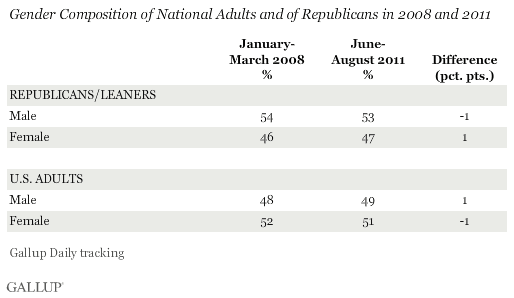
2. The U.S. population as a whole is slightly more likely to be female than male, while Republicans are slightly more likely to be male than female -- although slightly less so today than in 2008. The Republican Party's gender skew largely explains the gender gaps seen in voting behavior and presidential job approval.
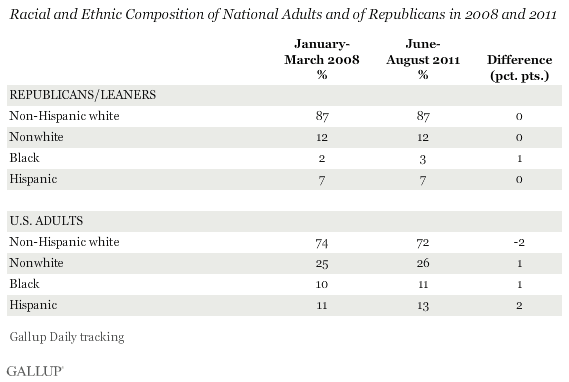
3. Republicans are significantly more likely than the overall population to be non-Hispanic whites -- 87% vs. 72%, respectively, in 2011 -- and this has not changed since 2008. Most of the remaining Republicans (7%) are Hispanic, while 3% are black. The 12% of Republicans who are nonwhite contrasts with the 26% of all U.S. adults in this category.
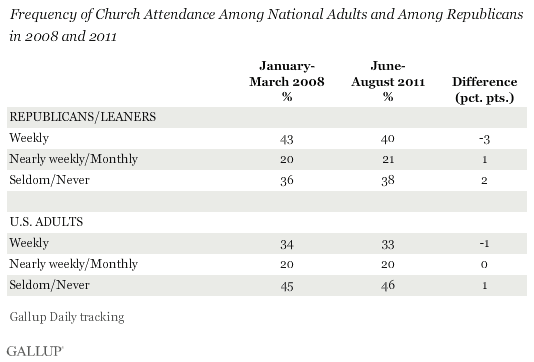
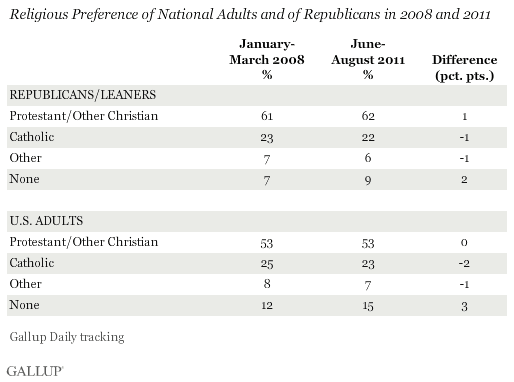
4. Republicans are more likely than the public at large to say they regularly attend their church or other place of worship; however, this distinction has diminished slightly since 2008. Forty percent of Republicans today say they attend church weekly, down from 43% in 2008. But there has also been a decline in weekly church attendance nationally since 2008, from 34% to 33%.
5. Republicans are more likely to identify as Protestants, and less likely to say they have no religious identity, than is the overall adult population, and these patterns are unchanged from 2008. The percentage of all Americans and of Republicans who say they are Catholic has decreased slightly over this time.
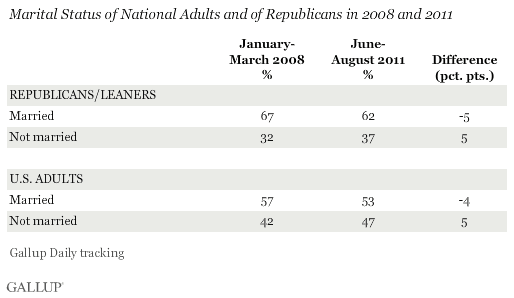
6. Republicans are significantly more likely to be married than the U.S. population as a whole, as was true in 2008. The percentage of adults in the U.S. population who are married has dropped since 2008, as has the percentage of Republicans who are married, but each by a similar amount.
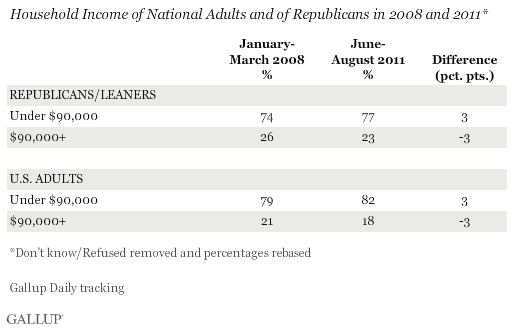
7. Republicans are more likely than the population as a whole to reside in higher-income households (those earning $90,000 or more per year). Twenty-three percent of Republicans who responded about their income are in upper-income households, compared with 18% of all Americans who responded. However, fewer Americans and Republicans fall into that high-income range than did so in 2008, perhaps an effect of the slow U.S. economy over the last three years.
Implications
The success of the Tea Party movement, essentially a subgroup of the larger Republican Party, in getting its preferred candidates nominated over establishment GOP choices in several elections in 2010 raised questions as to whether the Republican Party's direction was changing.
Gallup's analysis suggests the Republican rank-and-file, though slightly larger in number, is similar in demographic and ideological composition to what it was in 2008. From that perspective alone, it doesn't appear as if the GOP would necessarily reject a more moderate nominee (such as McCain in 2008) in favor of a more conservative one in 2012.
However, the selection of the Republican nominee for president will, as was the case in 2008, largely be determined by the candidates' strategies, whom they are running against, and how they fare in campaigning, debates, and early primaries and caucuses -- and not necessarily by who most closely matches the profile of Republicans nationally.
Survey Methods
Results are based on telephone interviews conducted as part of Gallup Daily tracking Jan. 2-March 31, 2008, and June 1-Aug. 31, 2011, with random samples of more than 88,000 adults each, aged 18 and older, living in all 50 U.S. states and the District of Columbia.
For results based on these total samples of national adults, one can say with 95% confidence that the maximum margin of sampling error is ±1 percentage points.
For results based on the total samples of 35,434 Republicans and Republican- leaning independents interviewed January-March 2008 and 39,095 Republicans and Republican-leaning independents interviewed June-August 2011, one can say with 95% confidence that the maximum margin of sampling error is ±1 percentage point.
Interviews are conducted with respondents on landline telephones and cellular phones, with interviews conducted in Spanish for respondents who are primarily Spanish-speaking. Each daily 2011 sample includes a minimum quota of 400 cell phone respondents and 600 landline respondents per 1,000 national adults, with additional minimum quotas among landline respondents by region. Landline telephone numbers are chosen at random among listed telephone numbers. Cell phone numbers are selected using random-digit-dial methods. Landline respondents are chosen at random within each household on the basis of which member had the most recent birthday.
Samples are weighted by gender, age, race, Hispanic ethnicity, education, region, adults in the household, and phone status (cell phone only/landline only/both, cell phone mostly, and having an unlisted landline number). Demographic weighting targets are based on the March 2010 Current Population Survey figures for the aged 18 and older non-institutionalized population living in U.S. telephone households. All reported margins of sampling error include the computed design effects for weighting and sample design.
In addition to sampling error, question wording and practical difficulties in conducting surveys can introduce error or bias into the findings of public opinion polls.
For more details on Gallup's polling methodology, visit www.gallup.com.
