PRINCETON, NJ -- In many respects, the demographic profile of Democrats nationwide is similar to what it was in 2008, although Democrats have become somewhat less white and more liberal than the party that nominated Barack Obama as its presidential candidate that year. As a group, Democrats are more likely than average to be women and nonwhite, less likely to be religious or married, much less likely to be conservative, and much more likely to be liberal than the U.S. population as a whole.
These results are based on a special Gallup analysis of the demographic and ideological composition of the U.S. population today (based on Gallup Daily tracking from June-August 2011) versus the start of 2008 presidential election campaign (from January-March). This is a follow-up to Gallup's earlier piece on the composition of the Republican rank-and-file.
For this analysis, the Democratic population is defined as those who either identify as Democrats or who identify as independents but say they lean toward the Democratic Party. Between the start of 2008 and today, the percentage of Americans identifying as Democrats or leaning Democratic has fallen from 50% to 43%. The percentage identifying as Republicans has risen from 37% to 40%, while the percentage of "pure" independents who do not lean toward either party has gone from 12% to 15%. The years 2006-2009 were recent high points in net Democratic affiliation, whereas the current figures showing a close split between Democrats (43%) and Republicans (40%) are more in line with the pattern that was in place between 2001 and 2004.
Key differences between Democrats and U.S. adults nationally, and changes since 2008, include:
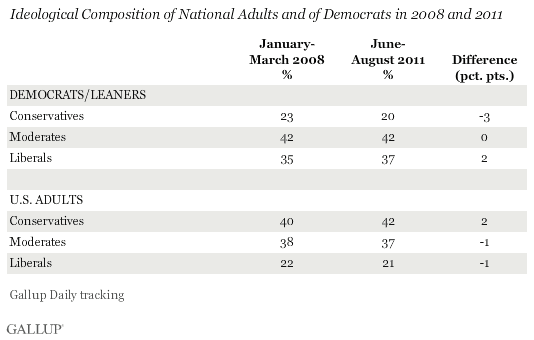
1. Perhaps the most significant change in the composition of Democrats between 2008 and today is the two-point increase, from 35% to 37%, in the percentage describing their political views as "liberal." This occurred at a time when the country as a whole became slightly more conservative, thus expanding the political gap between Democrats and the rest of the U.S.
The change coincides with the decline in Democratic affiliation in recent years, and it may be that moderate or conservative Americans were less well-attached to the Democratic Party and were the first to shift their allegiance -- thus leaving a higher concentration of political liberals among those who continue to align with the party.
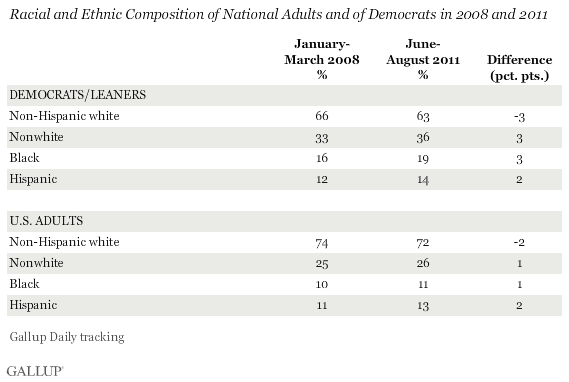
2. The racial and ethnic composition of the Democratic Party has also changed slightly. The proportion of Democrats who identify their race as black grew by three percentage points, from 16% to 19%, over the last three years, while the proportion that is white (non-Hispanic) fell by three points, from 66% to 63%. This contrasts with a smaller one-point increase in blacks and two-point decrease in whites nationally.
The percentage of Democrats who are Hispanic rose by two percentage points, from 12% to 14%, identical to the increase among all Americans.
3. Democrats remain less likely to attend church weekly and more likely to seldom or never attend church than the national average. The slight two-point decrease in Democrats who attend church weekly is similar to the one-point decrease in the national adult sample.
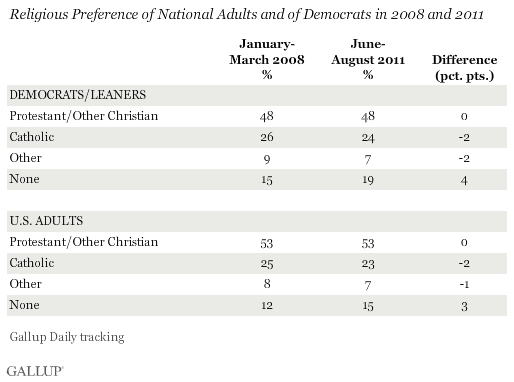
4. The proportion of Democrats who are Catholic or who identify with a non-Christian religion declined slightly between 2008 and 2011, while the percentage not identifying with any faith increased by four percentage points. The same trends are seen nationally, although they are less pronounced. In general, Democrats are slightly more likely than the national average to have no specific religious identity.
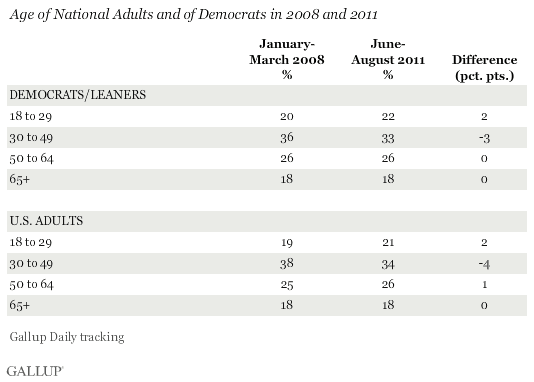
5. There has been little change in the composition of Democrats along age and gender lines. The percentage of the total national adult sample and the sample of Democrats in the 18 to 29 age group has increased slightly over the last three years. The percentage in the 30 to 49 age range has decreased in both groups. Young adults continue to make up a slightly greater proportion of the Democratic base than of the overall population.
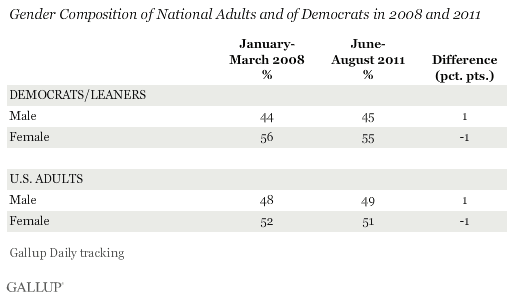
Democrats remain decidedly more female on average than the national population, with little significant change in this pattern over the last three years. This contrasts with the male skew in the Republican Party rank-and-file.
6. Democrats are significantly less likely than the U.S. population as a whole to be married, as was true in 2008. The percentage of adults in the U.S. population who are married has dropped since 2008, as has the percentage of Democrats who are married -- each by a similar amount.
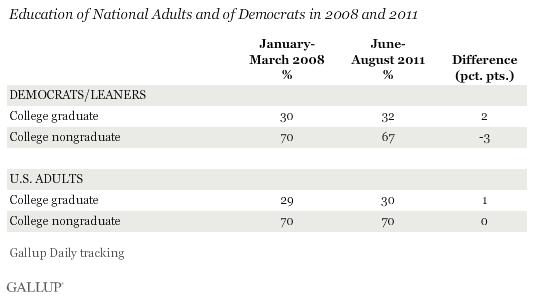
7. Democrats are now slightly more likely than the national population to be college educated, although the differences are not large. The percentage of Democrats who are college educated has risen from 30% in 2008 to 32% today. The college-educated percentage in the national population rose by one point over the same period.
Bottom Line
Gallup finds relatively little change in the demographic composition of either major party's supporters since 2008, even though the nation has become less Democratic, and more Republican and independent overall. All in all, Democrats remain decidedly less white, more female, more liberal, less religious, and less likely to be married than the general population.
Liberals and nonwhites have come to make up a slightly greater percentage of the Democratic base since 2008, perhaps indicating that the decline in Democratic affiliation since 2009 was proportionately greater among conservatives and whites.
The 2012 elections will thus likely show the same demographic voting patterns that prevailed in 2008, and that in many cases have been evident in presidential elections going back further in time.
Survey Methods
Results are based on telephone interviews conducted as part of Gallup Daily tracking Jan. 2-March 31, 2008, and June 1-Aug. 31, 2011, with random samples of more than 88,000 adults, aged 18 and older, living in all 50 U.S. states and the District of Columbia.
For results based on these total samples of national adults, one can say with 95% confidence that the maximum margin of sampling error is ±1 percentage point.
For results based on the total samples of 42,975 Democrats and Democratic- leaning independents interviewed January-March 2008 and 39,202 Democrats and Democratic-leaning independents interviewed June-August 2011, one can say with 95% confidence that the maximum margin of sampling error is ±1 percentage point.
Interviews are conducted with respondents on landline telephones and cellular phones, with interviews conducted in Spanish for respondents who are primarily Spanish-speaking. Each sample includes a minimum quota of 400 cell phone respondents and 600 landline respondents per 1,000 national adults, with additional minimum quotas among landline respondents by region. Landline telephone numbers are chosen at random among listed telephone numbers. Cell phone numbers are selected using random-digit-dial methods. Landline respondents are chosen at random within each household on the basis of which member had the most recent birthday.
Samples are weighted by gender, age, race, Hispanic ethnicity, education, region, adults in the household, and phone status (cell phone only/landline only/both, cell phone mostly, and having an unlisted landline number). Demographic weighting targets are based on the March 2010 Current Population Survey figures for the aged 18 and older non-institutionalized population living in U.S. telephone households. All reported margins of sampling error include the computed design effects for weighting and sample design.
In addition to sampling error, question wording and practical difficulties in conducting surveys can introduce error or bias into the findings of public opinion polls.
For more details on Gallup's polling methodology, visit www.gallup.com.
