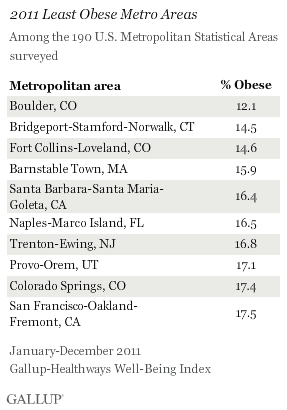
WASHINGTON, D.C. -- Adult obesity rates were higher than 15% in all but three of the 190 metropolitan areas that Gallup and Healthways surveyed in 2011. McAllen-Edinburg-Mission, Texas, residents were the most likely to be obese, at 38.8%, while people living in Boulder, Colo., were the least likely, at 12.1%.

 Nationwide, 26.1% of American adults were obese in 2011. The average obesity rate in the 10 metro areas with the highest obesity rates in 2011 was 34.8%, compared with 15.9% in the 10 metro areas where rates were lowest. Boulder, Bridgeport-Stamford-Norwalk, Conn., and Fort Collins-Loveland, Colo., are the only three metro areas that achieved the Centers for Disease Control and Prevention's nationwide goal of lowering obesity rates to 15%.
Gallup tracks U.S. obesity levels as part of the Gallup-Healthways Well-Being Index, using Americans' self-reported height and weight to calculate Body Mass Index (BMI) scores. BMI scores of 30 or higher are considered obese.
The 2011 metro area findings are extracted from Gallup's 2011 daily tracking data set of more than 350,000 U.S. adults, aged 18 and older, and living in ZIP codes that map to each respective metro area. Gallup categorizes U.S. metro areas according to the U.S. Office of Management and Budget's definitions for Metropolitan Statistical Areas (MSAs) and reports on all MSAs for which there are a minimum of 300 interviews available.
Chronic Conditions More Prevalent in Most Obese Metro Areas
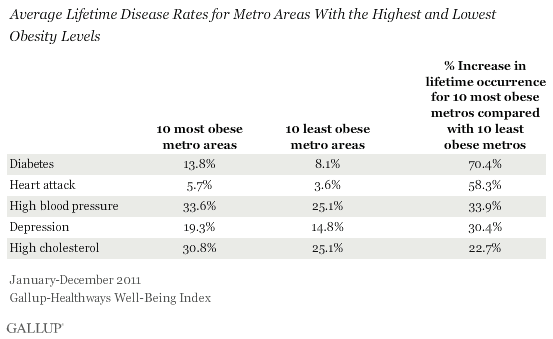
Those living in the 10 areas with the highest levels of obesity are much more likely to report a diagnosis of chronic diseases, including diabetes, high blood pressure, high cholesterol, and depression at some point in their lives than those living in the 10 areas with the lowest obesity rates. For example, reports of diabetes diagnoses are 70% higher, on average, in the 10 metro areas where obesity rates are highest than in the 10 places where obesity levels are lowest.
Residents living in the 10 cities where obesity rates are highest are also -- over the course of their lifetimes -- 58% more likely to report having had a heart attack, 34% more likely to report having high blood pressure, 30% more likely to be clinically diagnosed with depression, and 23% more likely to report having high cholesterol than are those living in the 10 cities where obesity rates are lowest.

Healthcare Costs and Potential Savings Significant for All Metro Areas
Americans living in the 10 metro areas where obesity rates are highest cumulatively pay an estimated $1 billion more in healthcare costs each year as a result of high obesity levels than they would if their obesity rates were 15%. This is based on an estimate provided by the National Institutes of Health of $1,429 per person per year in additional healthcare costs for obese persons compared with persons of normal weight.
For example, the McAllen-Edinburg-Mission metro area pays more than $400 million in unnecessary healthcare costs each year because of its high obesity rate. If it reduced the obesity rate to 15%, the area could potentially save more than $250 million annually. The estimated additional healthcare costs as a result of high obesity rates climb to $80 billion across all the 190 metro areas that Gallup and Healthways reported on in 2011.

See page 2 for full results for all reportable MSAs.
Bottom Line
Leaders of America's cities and metro areas where obesity rates are highest have a unique challenge because of the negative health outcomes and extra costs that are associated with high obesity rates. Even in metro areas that consistently post among the lowest obesity rates in the nation, such as Boulder and Fort Collins-Loveland, at least one in eight residents are still obese. The health and economic burden of the chronic conditions resulting from obesity is very real and very significant.
It is clear that every city in the nation has work to do to reverse an alarming trend with implications for Americans' collective physical health and financial bottom line. Achieving real and lasting improvement in Americans' health may come only with greater awareness, education, and initiatives at the community level. Such efforts likely have greater chances of success if leaders devote concerted and sustained resources to address the problem and can encourage healthcare, business, political, and educational leaders to share and discuss common goals and metrics to measure their efforts toward improvement.
About the Gallup-Healthways Well-Being Index
The Gallup-Healthways Well-Being Index tracks well-being in the U.S., U.K., and Germany and provides best-in-class solutions for a healthier world. To learn more, please visit well-beingindex.com.
Survey Methods
Results are based on telephone interviews conducted as part of the Gallup-Healthways Well-Being Index survey Jan. 2-Dec. 29, 2011, with a random sample of 353,492 adults, aged 18 and older, living in all 50 U.S. states and the District of Columbia, selected using random-digit-dial sampling.
The metro areas referenced in this article are based on the Metropolitan Statistical Areas (MSAs) as defined by the U.S. Office of Management and Budget. In many cases, more than one city is included in the same MSA. The San Jose, Calif., MSA, for example, also includes the smaller nearby cities of Sunnyvale and Santa Clara in addition to San Jose itself. Each respondent is attributed to his or her MSA based on the self-report of his or her ZIP code, and all metro areas had at least 300 completed surveys in 2011.
Maximum expected error ranges for the MSAs vary according to size, ranging from less than 1 percentage point for the largest cities represented to ±6.5 percentage points for the smallest.
Interviews are conducted with respondents on landline telephones and cellular phones, with interviews conducted in Spanish for respondents who are primarily Spanish-speaking. Each sample includes a minimum quota of 400 cell phone respondents and 600 landline respondents per 1,000 national adults, with additional minimum quotas among landline respondents by region. Landline telephone numbers are chosen at random among listed telephone numbers. Cell phone numbers are selected using random-digit-dial methods. Landline respondents are chosen at random within each household on the basis of which member had the most recent birthday.
Samples are weighted by gender, age, race, Hispanic ethnicity, education, region, adults in the household, and phone status (cell phone only/landline only/both, cell phone mostly, and having an unlisted landline number). Demographic weighting targets are based on the March 2010 Current Population Survey figures for the aged 18 and older non-institutionalized population living in U.S. telephone households. All reported margins of sampling error include the computed design effects for weighting and sample design.
In addition to sampling error, question wording and practical difficulties in conducting surveys can introduce error or bias into the findings of public opinion polls.
For more details on Gallup's polling methodology, visit www.gallup.com.


