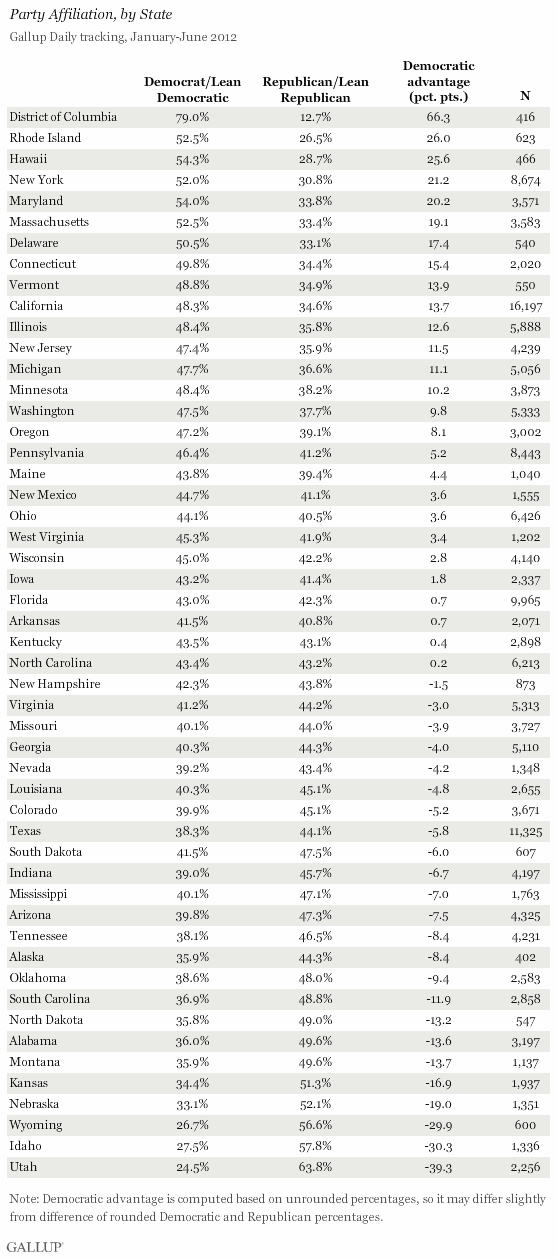
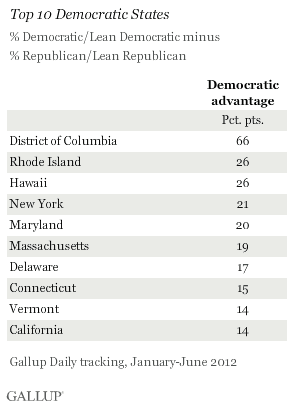
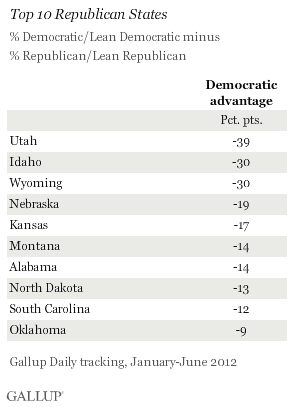
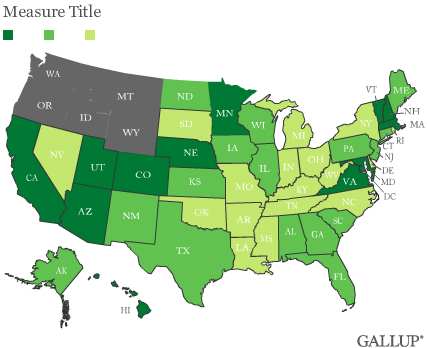
PRINCETON, NJ -- Along with the District of Columbia, Rhode Island and Hawaii rank as the most Democratic states in the country, followed by New York, Maryland, and Massachusetts. Rounding out the top 10 Democratic states are Delaware, Connecticut, Vermont, and California. Utah, Idaho, and Wyoming are the most Republican states.
Gallup determines the partisan orientation of each state by subtracting the total percentage of adults identifying as or leaning Republican from those identifying as or leaning Democratic, thus creating a "Democratic advantage" figure. Positive values indicate a state is more Democratic than Republican, while negative values indicate it is more Republican.
So far in 2012, 44% of all U.S. adults have identified as or lean Democratic and 40% are Republican.
The findings are based on Gallup Daily tracking from January through June 2012, encompassing interviews with more than 177,000 U.S. adults, including at least 1,000 in each of 41 states. Each state's data are weighted to match U.S. Census demographic parameters for that state's adult population.
Most of the top 10 Democratic states are located in the East -- in either the Northeast or Mid-Atlantic subregions, as Gallup has found in prior years. Just two -- Hawaii and California -- are outside this region. By contrast, the top 10 Republican states are found in all regions except the East, including the West, Midwest, and South. However, the top three Republican states -- Utah, Idaho, and Wyoming -- are all in the West.
Parties Matched in Overall State Leanings
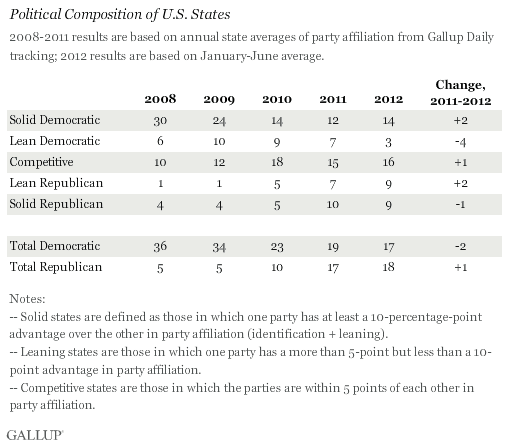
Overall, 17 states, including the District of Columbia, are either solidly Democratic or lean Democratic and 18 are solidly or leaning Republican. Gallup defines "solid" states for each party as those where the party has at least a 10-percentage-point advantage over the other, and "leaning" states as those where the party has more than a five- but less than a 10-point advantage.
That leaves 16 "competitive" states where the two parties are within five points of each other. While the party differences among all of these make them statistically tied, the parties may be most closely matched in Kentucky and North Carolina, where Gallup finds no differences in party preferences in the first half of 2012. Additionally, the parties are within one or two points of each other in Arkansas, Florida, Iowa, and New Hampshire.
2008 was a recent high point for Democratic political identification, likely owing to the waning popularity of Republican President George W. Bush, the economic crisis that erupted that year, and the ultimate appeal of Barack Obama late in the presidential campaign. That year, Gallup found 36 states either solidly Democratic or leaning to the party, and only five solidly or leaning Republican. Those figures largely held in 2009, but started shifting in 2010, with fewer Democratic states and an increased number of Republican and competitive states. Since 2011, the parties have been at rough numerical parity, although thus far in 2012, solidly Democratic states still outnumber solidly Republican states by a slight margin, 14 vs. nine.
State Party Leanings Mirror State Approval of Obama
Nationally, Obama averaged a 46% job approval rating from January to June, just slightly higher than the average 44% of adults who identify as or lean Democratic. Similarly, the midyear 2012 state findings for party ID largely align with President Obama's state-level job ratings, with his approval rating typically just a few points higher than the total percentage of Democrats.
However, in three states -- Hawaii (+9), Vermont (+7), and New Jersey (+6) -- Obama's job rating is at least six points higher than the total percentage of Democrats. In three others -- West Virginia (-14), Alaska (-7), and Nevada (-6) -- his approval rating is at least six points lower.
Bottom Line
Thus far in 2012, the two major parties have been closely matched nationally in terms of the absolute number of states each can claim as politically favorable, representing a dramatic change from 2008 and 2009 when the Democratic Party had an overwhelming advantage on this score. This doesn't translate directly into likely election outcomes, given differences that can exist between the party leanings of adults versus registered voters, as well as differing turnout patterns and voting behavior of Republicans vs. Democrats in some states.
Also, the Democratic Party remains generally stronger than the Republican Party in highly populous states with large numbers of Electoral College votes, thus requiring the Republican Party to win a greater proportion of big swing states such as Florida, Ohio, and North Carolina in order to achieve electoral victory this fall.
Survey Methods
Results are based on telephone interviews conducted as part of Gallup Daily tracking Jan. 1-June 30, 2012, with a random sample of 177,670 adults, aged 18 and older, living in all 50 U.S. states and the District of Columbia.
For results based on the total sample of national adults, one can say with 95% confidence that the maximum margin of sampling error is ±1 percentage point.
Margins of error for individual states are no greater than ±6 percentage points, and are ±3 percentage points in most states. The margin of error for the District of Columbia is ±6 percentage points.
Interviews are conducted with respondents on landline telephones and cellular phones, with interviews conducted in Spanish for respondents who are primarily Spanish-speaking. Each sample includes a minimum quota of 400 cell phone respondents and 600 landline respondents per 1,000 national adults, with additional minimum quotas among landline respondents by region. Landline telephone numbers are chosen at random among listed telephone numbers. Cell phone numbers are selected using random-digit-dial methods. Landline respondents are chosen at random within each household on the basis of which member had the most recent birthday.
Samples are weighted by gender, age, race, Hispanic ethnicity, education, region, adults in the household, and phone status (cell phone only/landline only/both, cell phone mostly, and having an unlisted landline number). Demographic weighting targets are based on the March 2011 Current Population Survey figures for the aged 18 and older non-institutionalized population living in U.S. telephone households. All reported margins of sampling error include the computed design effects for weighting and sample design.
In addition to sampling error, question wording and practical difficulties in conducting surveys can introduce error or bias into the findings of public opinion polls.
For more details on Gallup's polling methodology, visit www.gallup.com.