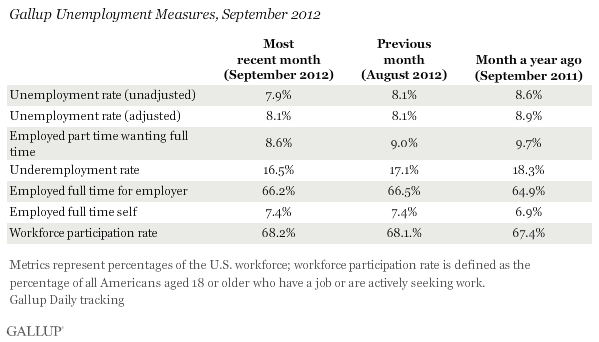
WASHINGTON, D.C. -- U.S. unemployment, as measured by Gallup without seasonal adjustment, was 7.9% for the month of September, unchanged from 7.9% measured in mid-September but down slightly from 8.1% for the month of August. Gallup's seasonally adjusted September unemployment rate was 8.1%, unchanged from August.
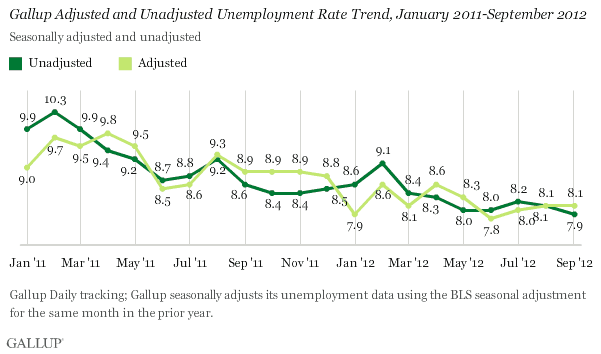
These results are based on Gallup Daily tracking interviews, conducted by landline and cell phone, with approximately 30,000 Americans throughout the month -- 68.2% of whom are active in the workforce. Gallup calculates a seasonally adjusted unemployment rate by applying the adjustment factor the government used for the same month in the previous year. The government made no adjustment to the August numbers last year, but adjusted September's up by 0.2 percentage points, which accounts for the flat seasonally adjusted unemployment rate in September despite the decline in the unadjusted rate.
The 7.9% unadjusted rate is the lowest Gallup has recorded since it began collecting employment data in January 2010. It is also significantly lower than the 8.6% rate measured in September 2011.
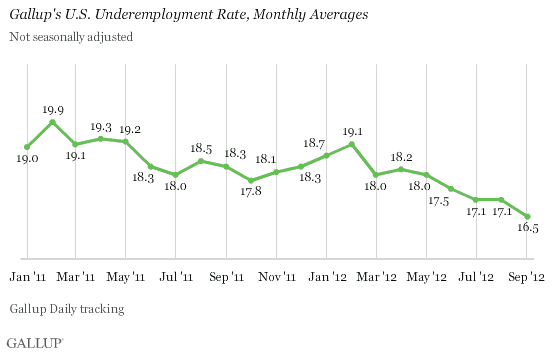
Underemployment, as measured without seasonal adjustment, was 16.5% in September -- also the lowest rate Gallup has recorded since it started collecting unemployment data in 2010. The September reading reflects more than a half-point drop since the end of August, and a nearly two-point improvement from the 18.3% measured in September 2011.
Gallup's U.S. underemployment measure combines the percentage who are unemployed with the percentage of those working part time but looking for full-time work. Gallup does not apply a seasonal adjustment to underemployment.
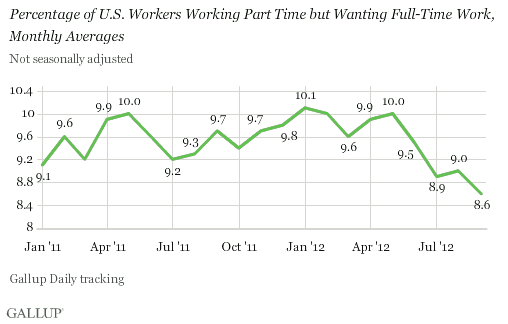
The decline in underemployment was driven by a decline in both unemployment and the number of part-timers wanting full-time work -- which is at 8.6% in September. This is near the lowest level in the Gallup trend, and is a full point lower than the 9.7% found in September 2011. Part-time hiring can fluctuate considerably depending on the season, so the significant change from September of a year ago is a positive sign that part-timers are finding the full-time work they desire.
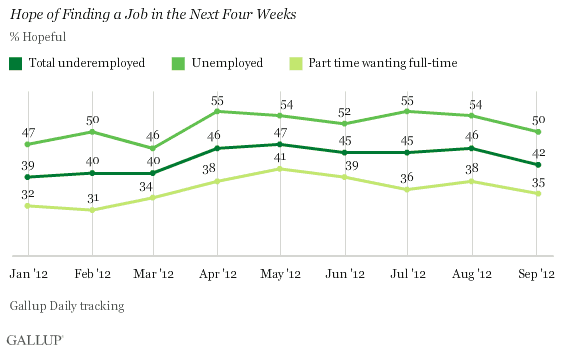
Despite Improvements, Hope Declines
In September, 42% of the underemployed were hopeful they would find the work they desire in the next four weeks, a decline from August, despite the improvements in the employment numbers. Hope declined among both the unemployed and part-timers who want to work full time, and both percentages are lower than one year ago. The unemployed continue to be the more hopeful of the two groups that they will find the employment they desire. It is likely that this is partly because the unemployed are by definition actively seeking work, while part-timers who want full-time work may not be doing anything more than waiting for full-time positions to become available at their current employer, a situation that may spark less hope.
Implications
Despite the slight decline in unemployment in September, unadjusted U.S. unemployment has remained relatively stagnant since May, and has shown little variation from May's 8.0% unadjusted rate. Greater change will be needed before unemployed and underemployed Americans begin to feel relief, which is likely reflected in their diminished levels of hope. Stagnant unemployment rates may be leading to feelings that there will not be an improvement in the near future.
Gallup's seasonally adjusted U.S. unemployment rate was flat in September, which suggests that the government's unemployment rate will be unchanged when the U.S. Bureau of Labor Statistics releases its jobs report on Friday morning, and will likely be at or within a tenth of a point of 8.1%.
Gallup.com reports results from these indexes in daily, weekly, and monthly averages and in Gallup.com stories. Complete trend data are always available to view and export in the following charts:
Daily: Employment, Economic Confidence, Job Creation, Consumer Spending
Weekly: Employment, Economic Confidence, Job Creation, Consumer Spending
Read more about Gallup's economic measures.
View our economic release schedule.
Survey Methods
Results are based on telephone interviews conducted as part of Gallup Daily tracking from Sept. 1-30, 2012, with a random sample of 30,331 adults, aged 18 and older, living in all 50 U.S. states and the District of Columbia, selected using random-digit-dial sampling.
For results based on the total sample of national adults, one can say with 95% confidence that the maximum margin of sampling error is ±1 percentage point.
Interviews are conducted with respondents on landline telephones and cellular phones, with interviews conducted in Spanish for respondents who are primarily Spanish-speaking. Each sample includes a minimum quota of 400 cell phone respondents and 600 landline respondents per 1,000 national adults, with additional minimum quotas among landline respondents by region. Landline telephone numbers are chosen at random among listed telephone numbers. Cell phone numbers are selected using random-digit-dial methods. Landline respondents are chosen at random within each household on the basis of which member had the most recent birthday.
Samples are weighted by gender, age, race, Hispanic ethnicity, education, region, adults in the household, and phone status (cell phone only/landline only/both, cell phone mostly, and having an unlisted landline number). Demographic weighting targets are based on the March 2011 Current Population Survey figures for the aged 18 and older non-institutionalized population living in U.S. telephone households. All reported margins of sampling error include the computed design effects for weighting and sample design.
In addition to sampling error, question wording and practical difficulties in conducting surveys can introduce error or bias into the findings of public opinion polls.
For more details on Gallup's polling methodology, visit www.gallup.com.