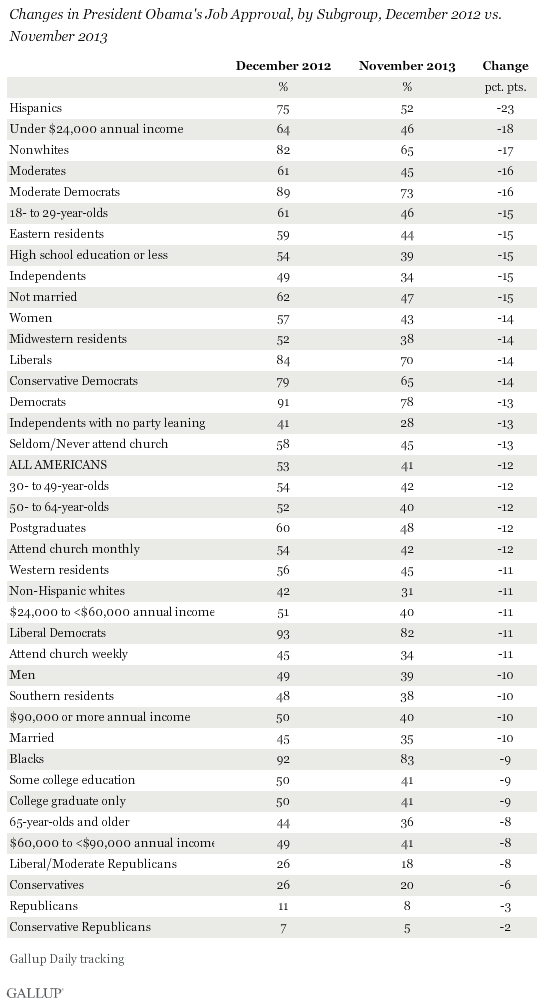
PRINCETON, NJ -- President Barack Obama's job approval rating averaged 41% in November, down 12 percentage points from 53% last December, his high-water mark since his first year in office. Hispanics' approval has dropped 23 points over the last 12 months, the most among major subgroups, and nearly twice the national average. His approval rating also showed above-average declines among low-income Americans, nonwhites, moderates, and moderates who identify with or lean toward the Democratic Party.
Hispanics' approval ratings of Obama have shown the most variation of any group's ratings throughout his presidency. That means their views of him are less firmly anchored than those of other groups, which may help explain why their opinions of the president soured more than any other group's in recent months. Despite the significant decline in their approval ratings over the past 12 months, a majority of Hispanics, 52%, still approve of the job Obama is doing.
All major subgroups showed at least some decline over the past year in their views of the way Obama is handling his job as president.
The subgroups showing the smallest changes are those that are generally least approving of Obama, and thus had less room to drop -- conservatives who identify with or lean toward the Republican Party (from 7% to 5%), self-identified Republicans (from 11% to 8%), and self-identified conservatives of any party affiliation (from 26% to 20%).
Obama's approval rating among his core political supporters -- who started at higher levels of approval last December -- show declines that match or exceed the national average. This includes a 13-point drop among self-identified Democrats, 14 points among self-identified liberals, and 11 points among liberals who identify as Democrats or lean toward the Democratic Party.
Still, these groups remain among the president's strongest supporters, as 78% of Democrats, 70% of liberals, and 82% of liberal Democrats still approve of Obama. Blacks give Obama the highest approval rating of any major subgroup, at 83%, although their approval has fallen by nine points in the last year.
Implications
Obama was re-elected with a 50% job approval rating, based on his October 2012 monthly average, which increased to an average 53% in December 2012. But the president has had a rough start to his second term, with the budget sequester in March, a partial federal government shutdown in October, and problems with the rollout of the 2010 healthcare law this fall. As a result, his job approval declined to 41% in November, matching the lowest monthly average of his presidency to date.
The decline is apparent among all major subgroups, but tends to be higher among groups that are predisposed to support the president, perhaps because those groups had higher levels of approval at his recent peak last December and thus had more room to decline. But if the U.S. economy and other national conditions improve in the future, those same groups are likely to lead a resurgence in Obama's approval ratings.
The more substantial drop in Hispanics' approval of the president may reflect, in part, the more volatile nature of their ratings. But it is also a troubling sign for the Democratic Party, given that Hispanics represent an increasingly important segment of the electorate.
Explore President Obama's approval ratings in depth and compare them with those of past presidents in the Gallup Presidential Job Approval Center.
Survey Methods
Results for this Gallup poll are based on telephone interviews conducted Nov. 1-30, 2013, on the Gallup Daily tracking survey, with a random sample of 14,352 adults, aged 18 and older, living in all 50 U.S. states and the District of Columbia.
For results based on the total sample of national adults, the margin of sampling error is ±1 percentage point at the 95% confidence level.
For results based on the total sample of 1,185 Hispanics, the margin of sampling error is ±4 percentage points at the 95% confidence level.
Interviews are conducted with respondents on landline telephones and cellular phones, with interviews conducted in Spanish for respondents who are primarily Spanish-speaking. Each sample of national adults includes a minimum quota of 50% cellphone respondents and 50% landline respondents, with additional minimum quotas by region. Landline and cell telephone numbers are selected using random-digit-dial methods. Landline respondents are chosen at random within each household on the basis of which member had the most recent birthday.
Samples are weighted to correct for unequal selection probability, nonresponse, and double coverage of landline and cell users in the two sampling frames. They are also weighted to match the national demographics of gender, age, race, Hispanic ethnicity, education, region, population density, and phone status (cellphone only/landline only/both, and cellphone mostly). Demographic weighting targets are based on the March 2012 Current Population Survey figures for the aged 18 and older U.S. population. Phone status targets are based on the July-December 2011 National Health Interview Survey. Population density targets are based on the 2010 census. All reported margins of sampling error include the computed design effects for weighting.
In addition to sampling error, question wording and practical difficulties in conducting surveys can introduce error or bias into the findings of public opinion polls.
For more details on Gallup's polling methodology, visit www.gallup.com.