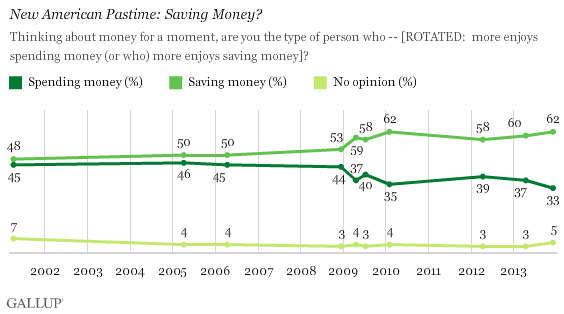
These results come from a Dec. 3-4 Gallup poll. Its findings reinforce the psychological effects the financial crisis and the deep recession have had on Americans. Americans' newfound enjoyment of saving corresponds with a reduction in overall household debt. In early 2009, even as the percentage who preferred saving money had risen to nearly six in 10, household debt as a percentage of GDP hovered around 98%. During the past five years, with the preference for saving continuing at this higher level, household debt has fallen to 81%, according to data from the Federal Reserve.
Perceived Spending Patterns in U.S. Stable Despite Holidays
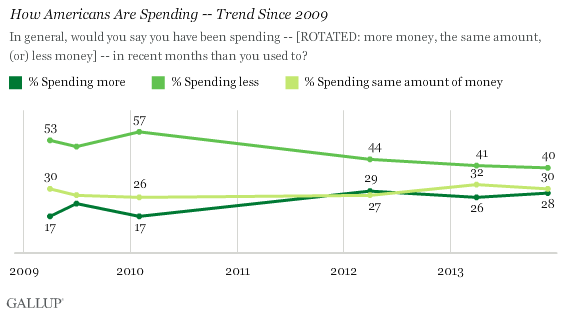
Although self-reported spending is up overall this year, with additional gains through Thanksgiving week, Americans don't necessarily perceive themselves as spending more. Forty percent say they are spending less in recent months than they used to, 28% say more, and 30% say the same amount. Those figures are essentially unchanged since April. However, the percentage who say they are spending less has declined substantially from where it was in the immediate post-recession period, including a peak of 57% in 2010. This suggests many Americans no longer feel much of the pressure to save that they felt during the recession.
Spending Less, Rather Than Spending More, Is Likely to Be New Normal
In a follow-up question, Gallup finds that the 40% "spending less" crowd is more likely to see their sudden thriftiness as a new, normal pattern (28%), rather than temporary (12%). Gallup found a similar pattern earlier this year.
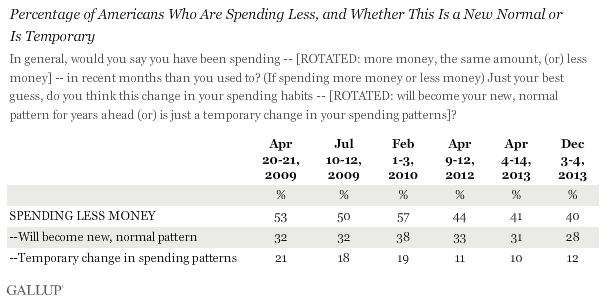
Notably, the percentage saying less spending is their new normal has declined, from 38% in 2010 to the current 28%.
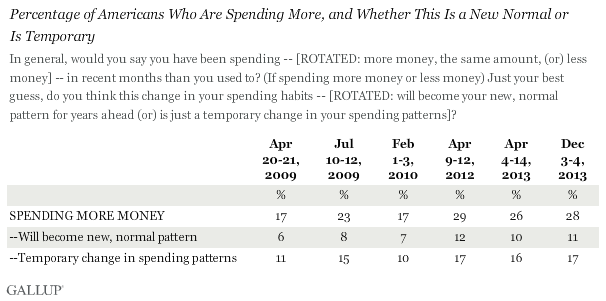
On the other hand, the 28% of Americans spending more than usual are less prone to see this situation as a new pattern -- 11% say this is a new normal, while 17% say it is a temporary change in spending patterns.
Implications
While Americans' attitudes seem stable, it is a matter of opinion as to whether they are at a healthy equilibrium for the larger economy. The U.S. economy is largely fueled by consumerism, yet most Americans widely prefer saving over spending -- a change witnessed over the course of the recession, and one that shows no sign of reversal. In other words, there may have been a psychological change in that most vital of economic actors -- the American consumer -- and how the economy adjusts to this shift has yet to be determined.
Survey Methods
Results for this Gallup poll are based on telephone interviews conducted Dec 3-4, 2013, on the Gallup Daily tracking survey, with a random sample of 1,017 adults, aged 18 and older, living in all 50 U.S. states and the District of Columbia.
For results based on the total sample of national adults, the margin of sampling error is ±4 percentage points at the 95% confidence level..
Interviews are conducted with respondents on landline telephones and cellular phones, with interviews conducted in Spanish for respondents who are primarily Spanish-speaking. Each sample of national adults includes a minimum quota of 50% cellphone respondents and 50% landline respondents, with additional minimum quotas by region. Landline and cell telephone numbers are selected using random-digit-dial methods. Landline respondents are chosen at random within each household on the basis of which member had the most recent birthday.
Samples are weighted to correct for unequal selection probability, nonresponse, and double coverage of landline and cell users in the two sampling frames. They are also weighted to match the national demographics of gender, age, race, Hispanic ethnicity, education, region, population density, and phone status (cellphone only/landline only/both, and cellphone mostly). Demographic weighting targets are based on the March 2012 Current Population Survey figures for the aged 18 and older U.S. population. Phone status targets are based on the July-December 2011 National Health Interview Survey. Population density targets are based on the 2010 census. All reported margins of sampling error include the computed design effects for weighting.
In addition to sampling error, question wording and practical difficulties in conducting surveys can introduce error or bias into the findings of public opinion polls.
View methodology, full question results, and trend data.
For more details on Gallup's polling methodology, visit www.gallup.com.
