WASHINGTON, D.C. -- The enduring unpopularity of Congress appears to have seeped into the nation's 435 congressional districts, as a record-low percentage of registered voters, 46%, now say the U.S. representative in their own congressional district deserves re-election. Equally historic, the share of voters saying most members of Congress deserve re-election has fallen to 17%, a new nadir.
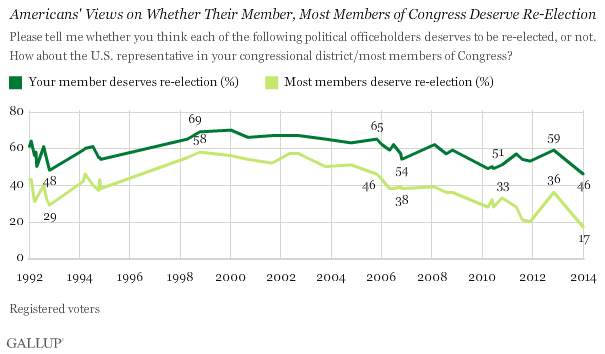
These findings are from Gallup's annual Mood of the Nation poll, conducted Jan. 5-8, 2014. The percentage of voters saying most members of Congress deserve re-election has been below its historical average of 39% since early 2008. The figure has plummeted since mid-2011, with a brief improvement -- to 36% -- in November 2012, attributable to a surge in Democratic support at the time of the national election.
The legendary Speaker of the House Tip O'Neill famously coined the phrase "all politics is local," a dictum that guided his Democratic majorities against Republican electoral waves in the 1980s. More generally, the saying describes the local versus national phenomenon that also occurs when the public is asked about such things as healthcare, education, and crime. But now that adage rings less true as voters see their own U.S. representative in the same way that they see most other members of Congress -- as not deserving re-election.
Can 2014 Be a "Wave" Election?
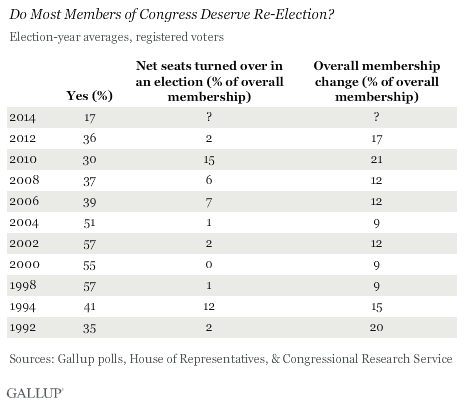
The 17% of voters who now say most of Congress deserves re-election is well below the roughly 40% threshold that has historically been associated with major electoral turnover. With this in mind, Congress could be in for a major shake-up. Judging by net seats lost in an election as a percentage of the overall number of seats, 2010, 1994, and 2006 register as the top three recent elections. All of these years had election-year averages of 41% or fewer voters saying most of Congress deserved re-election, with the Republican-wave election of 2010 registering the lowest, 30% -- still 13 percentage points higher than the current reading.
The political direction of any potential electoral wave is difficult to determine, however, as self-identified registered voters of both parties largely agree that most members of Congress do not deserve re-election. Eighteen percent of Republicans, the majority party in the House, say most members deserve re-election, identical to the percentage of Democrats saying so.
Thus, voters' wrath appears not to be directed toward one party in particular, as much as toward any incumbent member of Congress.
Implications
Consistent with abysmally low congressional approval ratings and widespread dissatisfaction with the nation's system of government, the proportion of registered voters saying Congress deserves re-election has hit an all-time low of 17%. While Congress as an institution is no stranger to voter disenchantment, American voters are usually more charitable in their assessments of their own representatives in the national legislature. But even this has fallen to a new trough.
Typically, results like these have presaged significant turnover in Congress, such as in 1994, 2006, and 2010. So Congress could be headed for a major shake-up in its membership this fall.
However, unlike those three years, when one party controlled both houses of Congress, the beneficiary of the anti-incumbent sentiment is not clear in the current situation, in which one party controls the House and the other, the Senate. Partisans on both sides of the aisle are displeased with Congress. But with so few voters saying they are willing to re-elect their own representative, it suggests that many officeholders will be vulnerable, if not in the general election, then perhaps in the host of competitive primaries soon to take place.
Survey Methods
Results for this Gallup poll are based on telephone interviews conducted Jan. 5-8, 2014, with a random sample of 1,018 adults, aged 18 and older, living in all 50 U.S. states and the District of Columbia.
For results based on the total sample of national adults, the margin of sampling error is ±4 percentage points at the 95% confidence level.
Interviews are conducted with respondents on landline telephones and cellular phones, with interviews conducted in Spanish for respondents who are primarily Spanish-speaking. Each sample of national adults includes a minimum quota of 50% cellphone respondents and 50% landline respondents, with additional minimum quotas by time zone within region. Landline and cellular telephone numbers are selected using random-digit-dial methods. Landline respondents are chosen at random within each household on the basis of which member had the most recent birthday.
Samples are weighted to correct for unequal selection probability, nonresponse, and double coverage of landline and cell users in the two sampling frames. They are also weighted to match the national demographics of gender, age, race, Hispanic ethnicity, education, region, population density, and phone status (cellphone only/landline only/both, cellphone mostly, and having an unlisted landline number). Demographic weighting targets are based on the most recent Current Population Survey figures for the aged 18 and older U.S. population. Phone status targets are based on the most recent National Health Interview Survey. Population density targets are based on the most recent U.S. census. All reported margins of sampling error include the computed design effects for weighting.
In addition to sampling error, question wording and practical difficulties in conducting surveys can introduce error or bias into the findings of public opinion polls.
View methodology, full question results, and trend data.
For more details on Gallup's polling methodology, visit www.gallup.com.