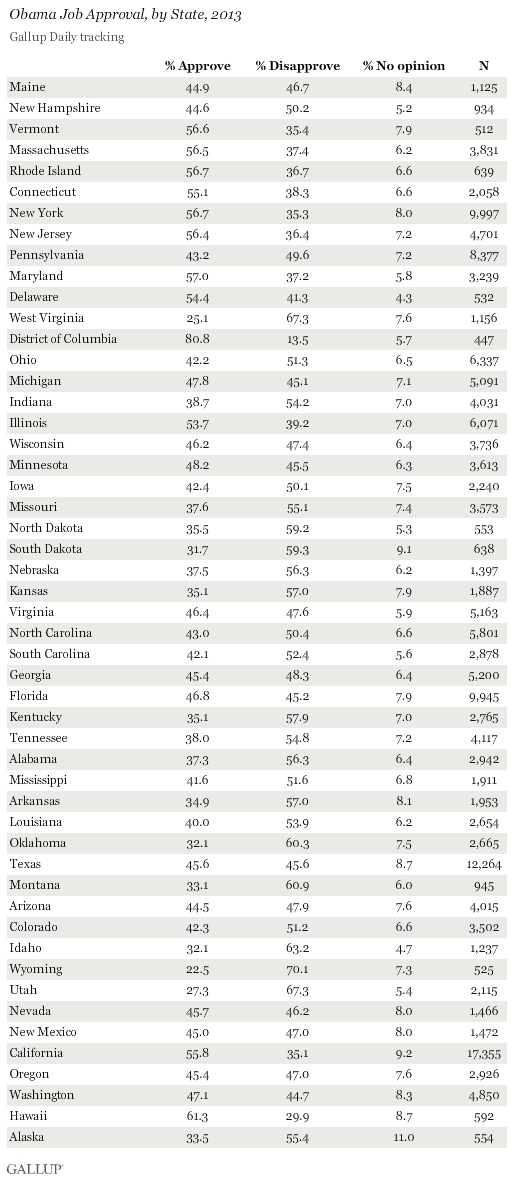
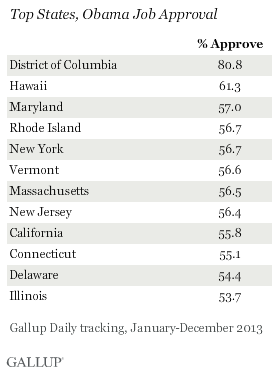
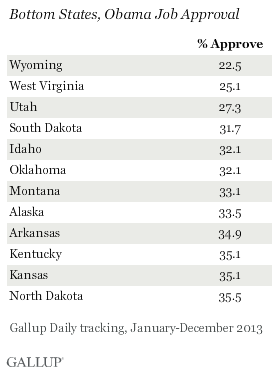
PRINCETON, NJ -- Residents of 11 states and the District of Columbia gave President Barack Obama job approval ratings above 50% in 2013. Hawaii had the highest approval rating among the 50 states at 61%, while more than eight in 10 District of Columbia residents also approved. In three states -- Wyoming, West Virginia, and Utah -- fewer than three in 10 residents approved.
 |
| Explore complete state data > |
The results are based on more than 178,000 Gallup Daily tracking interviews conducted nationwide throughout 2013. Each state's sample had a minimum of 500 respondents, and Gallup interviewed at least 1,000 residents in 40 different states. The state samples were weighted to ensure they were demographically representative of the state's adult population. The full results for each state are shown on page 2.
Obama's average approval rating declined about two percentage points nationally in 2013 versus 2012, and his approval rating in most states showed at least some decline. In three states -- Washington, Minnesota, and Michigan -- his job approval dropped below the majority level. His approval rating did not improve by a statistically significant amount in any state.
Throughout Obama's presidency, the most approving and least approving states have mostly stayed the same. In addition to the District of Columbia, seven states have been among the 10 most approving each year since 2009 -- Hawaii, Maryland, New York, Massachusetts, Connecticut, Vermont, and California. New Jersey, Rhode Island, and Delaware have ranked among the 10 most approving states in all but one year of Obama's presidency. Hawaii has ranked first among states each year, and Maryland has been second in all but one year.
Eight states have ranked among the 10 least approving every year Obama has been in office -- Wyoming, Idaho, West Virginia, Alaska, Utah, Oklahoma, Montana, and Arkansas. Wyoming residents gave Obama his lowest average state approval rating in three of the five years he has been president, and Utah residents did so twice.
Approval ratings of Obama vary regionally, with the highest ratings generally coming from Northeastern and Mid-Atlantic states, and his lowest approval ratings tending to come from states in the Mountain West and parts of the South.
Implications
Obama's relative popularity in each state takes on added significance this year because of November's midterm elections. In particular, Republicans hope to regain party control of the Senate for the first time since 2006.
Republican candidates in states in which Obama is unpopular will attempt to link their Democratic challenger to the president to help their election prospects. In contrast, Democratic candidates in states in which Obama is popular may benefit politically from the association, which may include a visit from Obama to the state to campaign on the candidate's behalf.
Obama's job approval ratings could change significantly between now and the elections, so while the 2013 averages provide a good indication of his strongest and weakest states, they may not be indicative of his ratings in November, when the elections take place. For example, Obama's current job approval ratings in most states are likely a few points lower now than their 2013 averages, given that he has averaged 41% job approval so far in January, compared with the 46% average for his fifth year in office.
Gallup's "State of the States" series reveals state-by-state differences on political, economic, and well-being measures Gallup tracks each day. New stories based on full-year 2013 data will be released in the coming months.
Explore President Obama's approval ratings in depth and compare them with those of past presidents in the Gallup Presidential Job Approval Center.
Survey Methods
Results for this Gallup poll are based on telephone interviews conducted Jan. 2-Dec. 29, 2013, on the Gallup Daily tracking survey, with a random sample of 178,527 adults, aged 18 and older, living in all 50 U.S. states and the District of Columbia.
For results based on the total sample of national adults, the margin of sampling error is ±1 percentage point at the 95% confidence level.
Margins of error for individual states are no greater than ±6 percentage points, and are ±3 percentage points in most states. The margin of error for the District of Columbia is ±6 percentage points.
Interviews are conducted with respondents on landline telephones and cellular phones, with interviews conducted in Spanish for respondents who are primarily Spanish-speaking. Each sample of national adults includes a minimum quota of 50% cellphone respondents and 50% landline respondents, with additional minimum quotas by time zone within region. Landline and cellular telephone numbers are selected using random-digit-dial methods. Landline respondents are chosen at random within each household on the basis of which member had the most recent birthday.
Samples are weighted to correct for unequal selection probability, nonresponse, and double coverage of landline and cell users in the two sampling frames. They are also weighted to match the national demographics of gender, age, race, Hispanic ethnicity, education, region, population density, and phone status (cellphone only/landline only/both, cellphone mostly, and having an unlisted landline number). Demographic weighting targets are based on the most recent Current Population Survey figures for the aged 18 and older U.S. population. Phone status targets are based on the most recent National Health Interview Survey. Population density targets are based on the most recent U.S. census. All reported margins of sampling error include the computed design effects for weighting.
In addition to sampling error, question wording and practical difficulties in conducting surveys can introduce error or bias into the findings of public opinion polls.
For more details on Gallup's polling methodology, visit www.gallup.com.