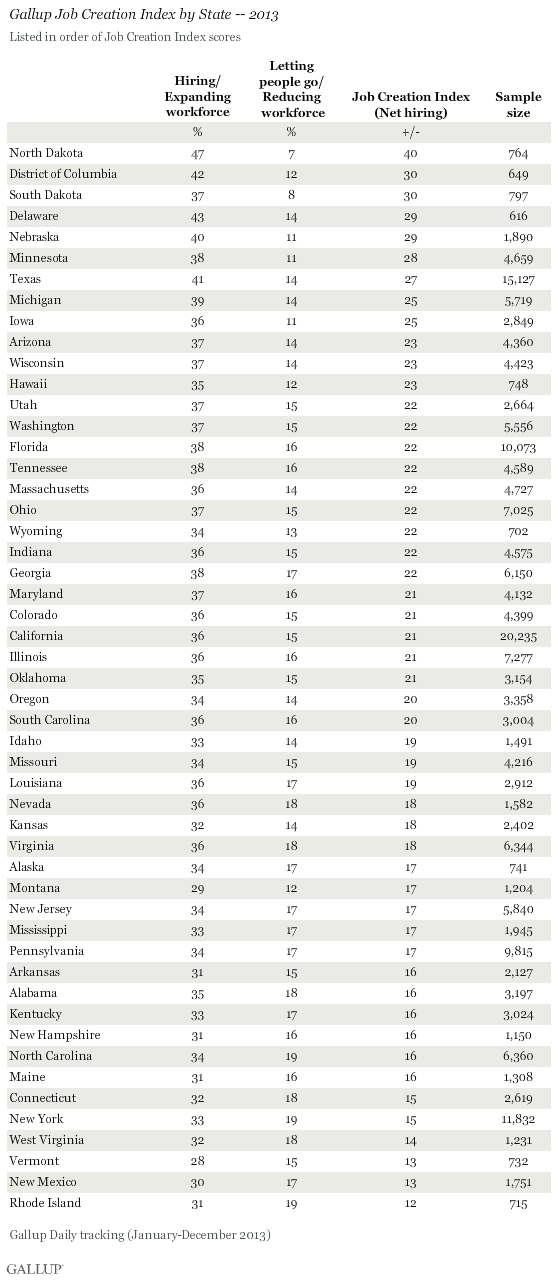
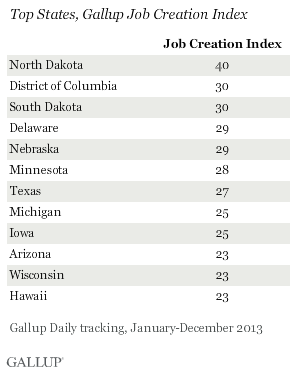
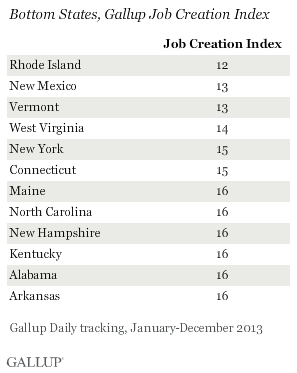
PRINCETON, NJ -- For the fifth consecutive year, North Dakota topped all other states in employee perceptions of job creation at their workplaces in 2013, as measured by the Gallup Job Creation Index. North Dakota's +40 index score easily surpasses the District of Columbia's and South Dakota's second-place +30 scores. Rhode Island workers saw the least job creation, with a +12 score.
Gallup's Job Creation Index is a measure of net hiring, determined by asking full- and part-time U.S. workers, aged 18 and older, whether their employer is hiring new people and expanding the size of its workforce, not changing the size of its workforce, or letting people go and reducing the size of its workforce. The index score is the difference between reported "hiring" and "letting go." Full results by state can be found on page 2.
North Dakota has ranked No. 1 among U.S. states for job creation in each of the last five years, and it has appeared in Gallup's top 10 in all six years since the inception of the Gallup Job Creation Index in 2008.
 |
| Explore complete state data > |
Two states -- Rhode Island and Connecticut -- have the unwanted distinction of appearing in the bottom tier for job creation every year since 2008. New York has been in the low-ranking group each of the past four years, New Mexico each of the past three years, and West Virginia for the past two years. Vermont, New Hampshire, Maine, and North Carolina have made occasional appearances, while 2013 was the first year for Kentucky, Alabama, and Arkansas.
Nationally, net hiring increased slightly in 2013, with the Job Creation Index averaging +20 during the year, up from +18 in 2012. The index was relatively stable in most states, but rose by significantly more than the average in a handful -- most notably Delaware (up 15 points to +29), Florida (up seven points to +22), and California (up seven points to +21).
Job Creation Index Linked With Standard of Living Perceptions
Three of the five states with the longest track records at the top of the state job creation ranking -- North Dakota, South Dakota, and Nebraska -- are strongly Republican in party affiliation. All three states with a long track record (at least four years) at the bottom -- Rhode Island, Connecticut, and New York -- are heavily Democratic. However, apart from this, there is little correspondence between net hiring and partisan affiliation in the states.
At the same time, there is a strong connection between employee reports of net hiring and Americans' perceptions of their standard of living. States with higher Job Creation Index scores tend to have higher standard-of-living scores, and vice versa. There is a lesser, but still strong, relationship between the Job Creation Index and Americans' confidence in the national economy, as measured by Gallup's Economic Confidence Index.
Bottom Line
Nationally, reported job creation was fairly flat in 2013, with Gallup's overall Job Creation Index inching up two points to +20. Within the states, the index varied in a 28-point range from +12 in Rhode Island to +40 in North Dakota. Many of the states in the highest and lowest tiers carried over from 2012; but there was also some shuffling. Most notably, net hiring in Delaware as reported by workers residing in that state rose sharply, enough to convert Delaware from one of the lowest-ranking states to one of the highest. Whether that represents a statistical anomaly or a sign of real improvement in the jobs picture in that state will become clear in 2014.
Along the same lines, from 2008 through 2011, West Virginia had been one of the highest-ranking states. It then dropped to one of the lowest in 2012, and remained there in 2013 -- thus confirming the 2012 finding. How much of this is due to reported declines in coal production in that state is unclear, but it bears watching in 2014.
The good news about the Gallup Job Creation Index nationally is that it has recovered from the net-negative reading Gallup recorded in 2009, and since then nearly all states have shown substantial improvement.
Thus far in 2014, the index remains near +20. However, as was seen in 2013, even if that score persists, important state-level shifts could be happening.
Gallup's "State of the States" series reveals state-by-state differences on political, economic, and well-being measures Gallup tracks each day. New stories based on full-year 2013 data will be released in the coming months.
Gallup.com reports results from these indexes in daily, weekly, and monthly averages and in Gallup.com stories. Complete trend data are always available to view and export in the following charts:
Daily: Employment, Economic Confidence, Job Creation, Consumer Spending
Weekly: Employment, Economic Confidence, Job Creation, Consumer Spending
Read more about Gallup's economic measures.
View our economic release schedule.
Survey Methods
These results are based on telephone interviews conducted as part of Gallup Daily tracking Jan. 2-Dec. 29, 2013, with a random sample of 208,758 adults, aged 18 and older, employed full or part time, living in all 50 U.S. states and the District of Columbia.
For results based on the total sample of employed adults, the margin of sampling error is ±1 percentage point at the 95% confidence level.
Margins of error for individual states are no greater than ±6 percentage points, and are ±3 percentage points in most states. The margin of error for the District of Columbia is ±6 percentage points.
Interviews are conducted with respondents on landline telephones and cellular phones, with interviews conducted in Spanish for respondents who are primarily Spanish-speaking. Each sample of national adults includes a minimum quota of 50% cellphone respondents and 50% landline respondents, with additional minimum quotas by region. Landline telephone numbers are chosen at random among listed telephone numbers. Cellphone numbers are selected using random-digit-dial methods. Landline respondents are chosen at random within each household on the basis of which member had the most recent birthday.
Samples are weighted to correct for unequal selection probability, nonresponse, and double coverage of landline and cell users in the two sampling frames. They are also weighted to match the national demographics of gender, age, race, Hispanic ethnicity, education, region, population density, and phone status (cellphone only/landline only/both, cellphone mostly, and having an unlisted landline number). Demographic weighting targets are based on the most recent Current Population Survey figures for the aged 18 and older U.S. population. Phone status targets are based on the most recent National Health Interview Survey. Population density targets are based on the most recent U.S. census. All reported margins of sampling error include the computed design effects for weighting.
In addition to sampling error, question wording and practical difficulties in conducting surveys can introduce error or bias into the findings of public opinion polls.
For more details on Gallup's polling methodology, visit www.gallup.com.