WASHINGTON, D.C. -- Although scores on Gallup's Economic Confidence Index improved in most U.S. states in 2013, the index remained negative in all 50. Only the District of Columbia had a positive index. Indexes were least negative in Massachusetts, Minnesota, and California. They were most negative in West Virginia, followed by Alaska.
These results are based on Gallup Daily tracking interviews with 178,071 national adults conducted from January through December 2013, and represent averages for the year. Gallup conducted interviews with at least 500 residents in every state and interviewed 1,000 or more in 41 states. In the District of Columbia, 462 interviews were conducted.
 |
| Explore complete state data > |
The Gallup Economic Confidence Index is a composite of Americans' ratings of current U.S. economic conditions and their perceptions of the economy's direction. The index has a theoretical maximum of +100 (if all respondents rate the economy "excellent" or "good" and say it is getting better) and a theoretical minimum of -100 (if all rate the economy "poor" and say it is getting worse).
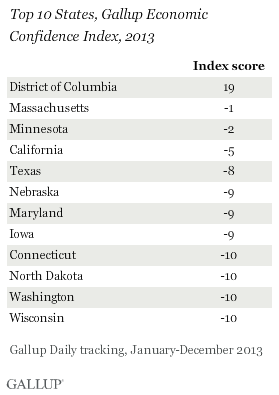
Most of the top 10 states in economic confidence in 2013 were the same as in 2012, but the rankings changed. Massachusetts (index score of -1) climbed five spots to top the list in 2013. California, Connecticut, Nebraska, and Wisconsin were new to the top 10, replacing Hawaii, South Dakota, and Virginia (because of ties, there were 12 states on the list in 2013, vs. 11 in 2012). Hawaii (-12 index score) and South Dakota (-21) were among the few states to experience decreases in their index scores last year. Hawaii's index, though still above the national average of -16, dropped three points and South Dakota's index dropped 10 points.
The District of Columbia (+19) is the clear outlier in economic confidence, having the only positive reading for 2013 and well above the readings for even the most optimistic states. Its confidence has taken a hit, however, since 2012, when its index was +29. Likely factors in the 10-point drop include October's federal government shutdown as well as the sequestration spending cuts that occurred earlier in the year.
Other states with indexes significantly above the national average were Minnesota (-2), California (-5), and Texas (-8), as well as Nebraska, Maryland, and Iowa (all at -9). Connecticut, North Dakota, Washington, and Wisconsin, at -10, also made the top 10.
Bottom 10 States Largely the Same as in 2012
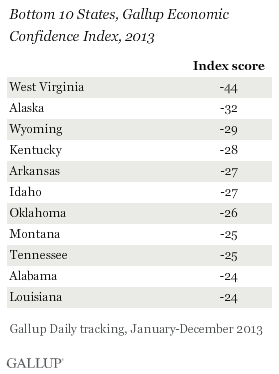
Of the bottom 10 states, all but Alaska and Louisiana were repeats from 2012, while some of the rest changed spots. The majority of the bottom 10 states are now in the South and West after being more geographically diverse in 2012. The indexes in Missouri and Vermont each improved by 11 points, enough to propel them out of the bottom 10. Mississippi, which improved six points, also broke out of the bottom 10.
West Virginia remains the least economically confident state (-44), having owned the title for the past four years. Alaska plunged to become the second-least economically confident state (-32), despite not being in the bottom 10 in 2012. Its index change of -6 between 2012 and 2013 falls within the margin of error. However, its index fell while most other states' indexes gained.
Eight of the states in the bottom 10 in 2013 were also in the bottom 10 in approval of President Barack Obama's job performance, underscoring the sometimes-political nature of economic confidence. Gallup has long observed that economic confidence is a complex consumer attitude that reflects real-world economic factors, but is also sensitive to the U.S. political environment, with members of the current president's party typically expressing more confidence than members of the opposing party.
Improvements in 2013 Were More Tempered Than the Increases in 2012
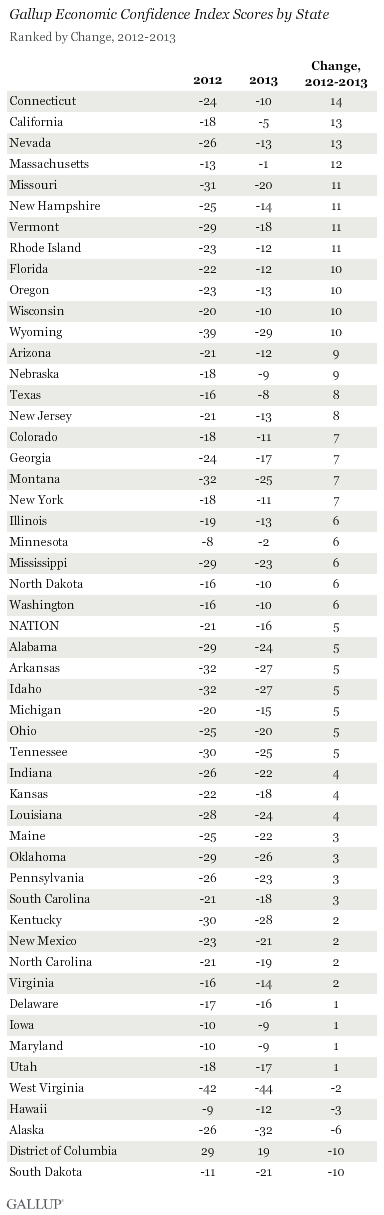
Individual state increases in economic confidence in 2013 were not as sweeping as those seen in 2012, when 48 of the 50 states saw gains in confidence, and the national average improved by 16 points. In 2013, the improvements were smaller, though noteworthy in a number of states.
The index in Connecticut improved most, climbing 14 points and securing a spot in the top 10 -- a distinction the state didn't share in 2012. The index in California, which also scored a new slot in the top 10, increased 13 points last year, as did Nevada's index. Massachusetts, which was near the middle of the top 10 in 2012, saw its index jump 12 points in 2013, earning it the title of most economically confident state of the year (-1).
Implications
Though U.S. economic confidence improved overall, it continues to vary widely across states. Forty-three points separate the most confident and least confident states, underscoring how different the nation's economic situation looks, depending on where Americans live.
Political sentiments play a role in confidence, as eight of the bottom 10 economic confidence states are also among the 10 lowest-ranking presidential approval states for Obama. Conversely, five of the highest-ranking economic confidence states are in the top 10 for presidential approval.
While confidence is negative for states across the nation, these polarized political divisions could play out in a variety of elections in 2014, as most states hold gubernatorial elections and all states have congressional elections. Candidates running on Republican tickets can attempt to paint this economic dissatisfaction as the fault of the Democratic president. Democratic candidates, on the other hand, will have to be sensitive to the low levels of economic confidence across the country -- particularly for Democrats running in the bottom 10 states.
Gallup's "State of the States" series reveals state-by-state differences on political, economic and well-being measures Gallup tracks each day. New stories based on full-year 2012 data will be released in coming months.
Gallup.com reports results from these indexes in daily, weekly, and monthly averages and in Gallup.com stories. Complete trend data are always available to view and export in the following charts:
Daily: Employment, Economic Confidence, Job Creation, Consumer Spending
Weekly: Employment, Economic Confidence, Job Creation, Consumer Spending
Read more about Gallup's economic measures.
View our economic release schedule.
Survey Methods
Results for this Gallup poll are based on telephone interviews conducted Jan. 2-Dec. 29, 2013, on the Gallup Daily tracking survey, with a random sample of 178,071 adults, aged 18 and older, living in all 50 U.S. states and the District of Columbia.
For results based on the total sample of national adults, the margin of sampling error is ±1 percentage point at the 95% confidence level.
Margins of error for individual states are no greater than ±6 percentage points, and are ±3 percentage points in most states. The margin of error for the District of Columbia is ±6 percentage points.
Interviews are conducted with respondents on landline telephones and cellular phones, with interviews conducted in Spanish for respondents who are primarily Spanish-speaking. Each sample of national adults includes a minimum quota of 50% cellphone respondents and 50% landline respondents, with additional minimum quotas by region. Landline telephone numbers are chosen at random among listed telephone numbers. Cellphone numbers are selected using random-digit-dial methods. Landline respondents are chosen at random within each household on the basis of which member had the most recent birthday.
Samples are weighted to correct for unequal selection probability, nonresponse, and double coverage of landline and cell users in the two sampling frames. They are also weighted to match the national demographics of gender, age, race, Hispanic ethnicity, education, region, population density, and phone status (cellphone only/landline only/both, cellphone mostly, and having an unlisted landline number). Demographic weighting targets are based on the most recent Current Population Survey figures for the aged 18 and older U.S. population. Phone status targets are based on the most recent National Health Interview Survey. Population density targets are based on the most recent U.S. census. All reported margins of sampling error include the computed design effects for weighting.
In addition to sampling error, question wording and practical difficulties in conducting surveys can introduce error or bias into the findings of public opinion polls.
For more details on Gallup's polling methodology, visit www.gallup.com.