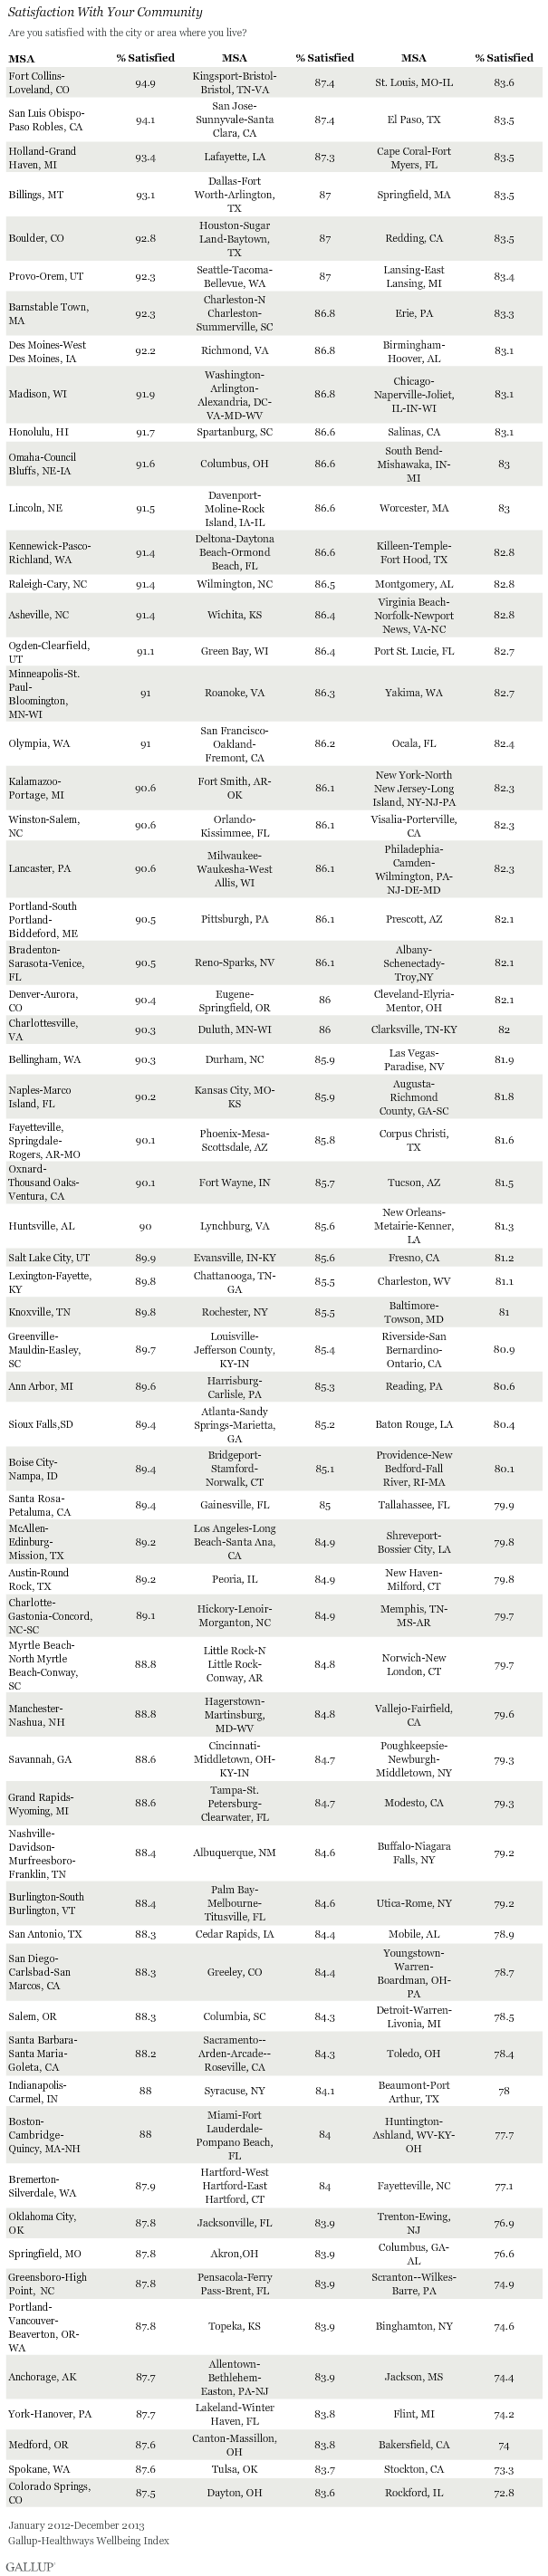
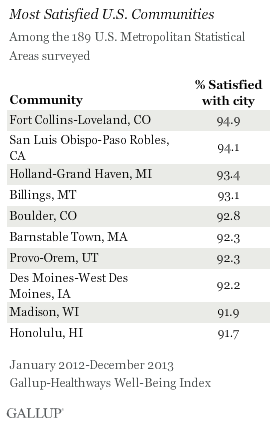
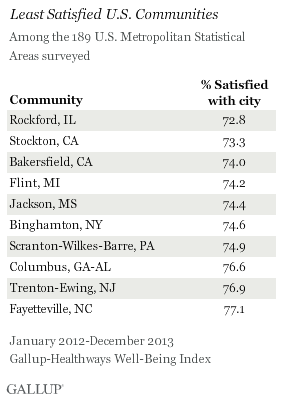
WASHINGTON, D.C. -- Fort Collins-Loveland, Colo. (94.9%) and San Luis Obispo-Paso Robles, Calif. (94.1%) residents were the most likely to be satisfied with the city or area where they live in 2012-2013. Residents of Rockford, Ill. (72.8%) and Stockton, Calif. (73.3%) had the lowest satisfaction rates. On an absolute basis, satisfaction is high in every community, with only seven out of 189 communities Gallup surveyed in 2012-2013 having satisfaction scores below 75%.
Gallup and Healthways asked Americans how satisfied they were with the city or area in which they lived as part of the Gallup-Healthways Well-Being Index. Gallup interviewed at least 300 adults aged 18 and older in 189 metropolitan areas throughout 2012-2013. Each sample was weighted to match the demographic characteristics of that area.
Nationally, 85.0% of Americans in 2012-2013 said they are satisfied with the city or area in which they live, which is consistent with the averages recorded since Gallup and Healthways began tracking this measure in 2008.
The satisfaction levels in the lowest-rated U.S. communities have improved since 2008, when the lowest rated community, Memphis, Tenn.-Miss.-Ark., had 68.8% of its residents satisfied with the area where they lived. In 2012-2013, the Memphis area did not fall among the lowest-rated communities, with 79.7% of residents satisfied.
Fort Collins-Loveland has been among the communities with the highest satisfaction levels three times since Gallup and Healthways began tracking in 2008, with its satisfaction rate coming in above 90% in each reporting period. Satisfaction among residents is a common characteristic of cities with high well-being, and the two measures are generally aligned most years.
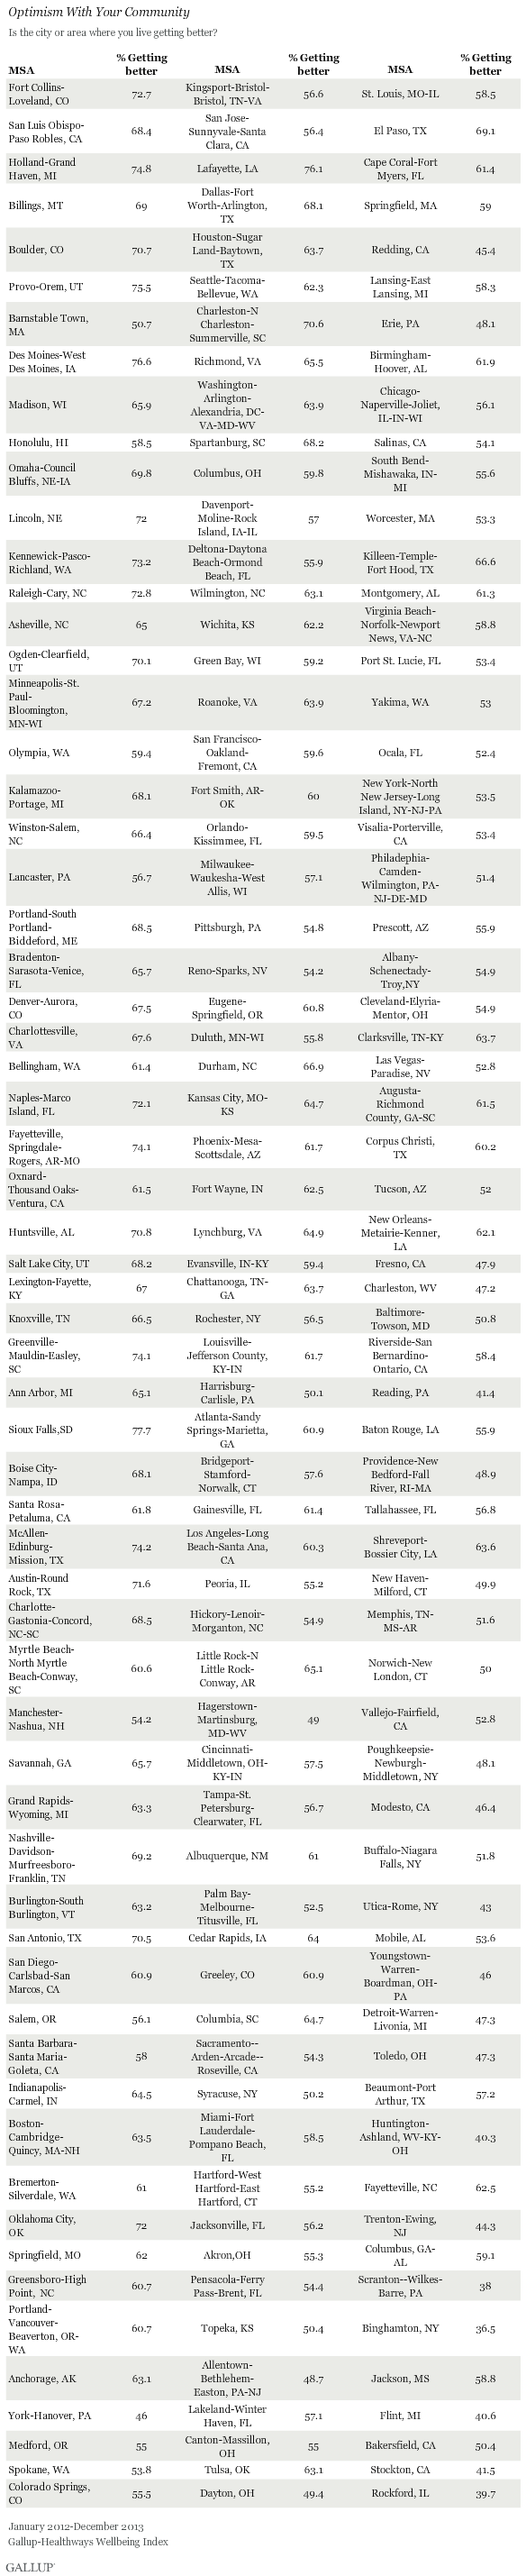
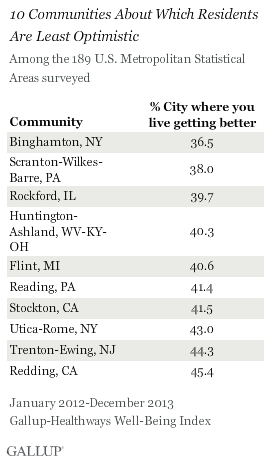
Optimism Higher in Communities Where Residents Are Already Satisfied
Nationally, 59.7% believe the city or area where they live is getting better, which is higher than Gallup and Healthways have found in past years. In 2009, 53.9% of Americans said their city or area was getting better -- the lowest national average Gallup has recorded for this question.
Residents of Binghamton, N.Y., are the least optimistic that their city is getting better, as has been the case since 2008, with the exception of 2009 when it was second from last. The 36.5% of Binghamton residents who said the area is getting better in 2012-2013 is an improvement from the low of 27.8% recorded in 2011.
Fort Collins-Loveland, the most satisfied city in 2012-2013, just barely missed ranking in the top 10 for city optimism in 2012-2013, with 72.7% of residents saying the area is getting better. Fort Collins-Loveland did rank among the top 10 for city optimism in 2010 and 2011.
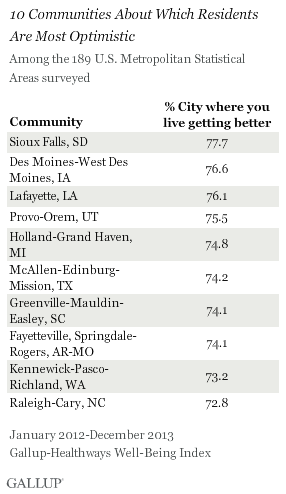
In communities with higher satisfaction rates, residents are more likely to be optimistic that the area is improving than are residents of communities with lower satisfaction rates.
Among the 10 communities with the lowest levels of satisfaction, six are also on the list of communities with the 10 lowest levels of optimism. Three of the communities with the highest levels of satisfaction among residents are among the 10 communities where residents are most likely to say the community is getting better. In Rockford, the community with the lowest satisfaction rate, 39.7% of residents said the community is improving -- the third-lowest score in the nation.
Implications
In every U.S. community, the majority of residents are satisfied with the city or area where they live. These high satisfaction rates are understandable because residents who are dissatisfied with where they were living would likely relocate to another area, if they had the means to.
Satisfaction rates vary from almost 95% of residents being satisfied in Fort Collins-Loveland to less than 73% in Rockford. These satisfaction levels may vary because of job opportunities or residents' overall well-being. Fort Collins-Loveland and San Luis Obispo-Paso Robles were among the communities with the highest Well-Being Index scores in 2012-2013. However, neither Rockford nor Stockton were among the communities with the lowest Well-Being Index scores.
Cities that have a higher percentage of dissatisfied residents are also less likely to be seen as improving by those who live there. This means that residents who are unhappy with their communities also don't think their communities are getting better, and residents who are happy with the city or area where they live do feel their community is improving.
Fort Collins-Loveland residents' satisfaction with their community may be linked to the community's success in other aspects of life. In 2012-2013, Fort Collins-Loveland ranked high in terms of communities where residents have easy access to fruit and vegetables. It was also one of the towns that inspired Main Street, U.S.A. at Disneyland.
Rockford, on the other hand, has seen better times. While the city used to be a major manufacturing hub, many companies have since closed local plants. And Woodward Inc., a maker of aircraft fuel system components, though founded in Rockford, has moved its headquarters to Fort Collins. Rockford has recently been plagued by high unemployment and high property taxes, and the community ranked third on the 2013 Forbes List of America's Most Miserable Cities because of a three-decade decline in their manufacturing based economy.
Survey Methods
Results are based on telephone interviews conducted as part of the Gallup-Healthways Well-Being Index survey Jan. 2-Dec. 29, 2012, and Jan. 2-Dec. 30, 2013, with a random sample of 531,630 adults, aged 18 and older, living in metropolitan areas in the 50 U.S. states and the District of Columbia, selected using random-digit-dial sampling. Two years of data were aggregated together to enable the same number of reportable cities as in prior years, when the overall annual data collection exceeded 350,000 interviews per year compared to 178,072 interviews conducted in 2013. At least 300 cases are required per metro area for reporting.
The metro areas referenced in this article are based on the Metropolitan Statistical Areas (MSAs) as defined by the U.S. Office of Management and Budget. In many cases, more than one city is included in the same MSA. The San Jose, Calif., metropolitan statistical area, for example, also includes the smaller nearby cities of Sunnyvale and Santa Clara in addition to San Jose itself. Each respondent is attributed to his or her MSA based on the self-report of his or her ZIP code, and all metro areas had at least 300 completed surveys in the 2012-2013 data collection period.
Maximum expected error ranges for the Well-Being Index and the sub-index scores vary according to MSA size, ranging from less than 1 point for the largest cities represented to ±1.5 points for the smallest cities.
Interviews are conducted with respondents on landline telephones and cellular phones, with interviews conducted in Spanish for respondents who are primarily Spanish-speaking. Each sample of national adults includes a minimum quota of 50% cellphone respondents and 50% landline respondents, with additional minimum quotas by time zone within region. Landline and cellular telephone numbers are selected using random-digit-dial methods. Landline respondents are chosen at random within each household on the basis of which member had the most recent birthday.
Samples are weighted to correct for unequal selection probability, nonresponse, and double coverage of landline and cell users in the two sampling frames. They are also weighted to match the national demographics of gender, age, race, Hispanic ethnicity, education, region, population density, and phone status (cellphone only/landline only/both, and cellphone mostly). Demographic weighting targets are based on the most recent Current Population Survey figures for the aged 18 and older U.S. population. Phone status targets are based on the most recent National Health Interview Survey. Population density targets are based on the most recent U.S. census. All reported margins of sampling error include the computed design effects for weighting.
In addition to sampling error, question wording and practical difficulties in conducting surveys can introduce error or bias into the findings of public opinion polls.
For more details on Gallup's polling methodology, visit www.gallup.com.