Race Relations
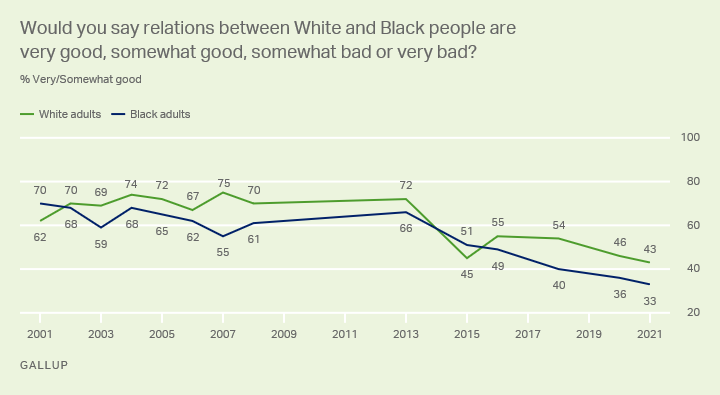
Line graph. In Gallup's latest reading, from July 2021, 43% of White adults currently believe relations between White and Black people are very or somewhat good. 33% of Black adults say the same.
Next, we'd like to know how you would rate relations between various groups in the United States these days. Would you say relations between -- White and Black people -- are very good, somewhat good, somewhat bad or very bad?
| Very good | Somewhat good | Somewhat bad | Very bad | No opinion | |
|---|---|---|---|---|---|
| % | % | % | % | % | |
| National adults | |||||
| 2021 Jun 1-Jul 5 | 8 | 34 | 34 | 23 | 1 |
| 2020 Jun 8-Jul 24 | 7 | 37 | 31 | 24 | * |
| 2018 Nov 19-Dec 22 | 10 | 41 | 30 | 17 | 1 |
| 2016 Jun 7-Jul 1 | 7 | 46 | 32 | 14 | 1 |
| 2015 Jun 15-Jul 10 | 9 | 38 | 36 | 17 | 1 |
| 2013 Jun 13-Jul 5 | 13 | 57 | 23 | 7 | 1 |
| 2008 Jun 5-Jul 6 | 10 | 58 | 23 | 7 | 2 |
| 2007 Jun 4-24 | 10 | 61 | 24 | 4 | 1 |
| 2006 Jun 8-25 | 9 | 55 | 25 | 9 | 2 |
| 2005 Jun 6-25 | 11 | 57 | 23 | 6 | 3 |
| 2004 Jun 9-30 | 13 | 59 | 20 | 6 | 2 |
| 2003 Jun 12-18 | 10 | 58 | 24 | 6 | 2 |
| 2002 Jun 3-9 | 8 | 61 | 23 | 5 | 3 |
| 2001 Jun 11-17 | 6 | 57 | 28 | 7 | 2 |
| White adults | |||||
| 2021 Jun 1-Jul 5 | 8 | 35 | 35 | 21 | 1 |
| 2020 Jun 8-Jul 24 | 8 | 38 | 33 | 21 | * |
| 2018 Nov 19-Dec 22 | 11 | 43 | 31 | 14 | 1 |
| 2016 Jun 7-Jul 1 | 7 | 48 | 32 | 12 | 1 |
| 2015 Jun 15-Jul 10 | 8 | 37 | 40 | 14 | 1 |
| 2013 Jun 13-Jul 5 | 14 | 58 | 22 | 5 | * |
| 2008 Jun 5-Jul 6 | 11 | 59 | 23 | 6 | 1 |
| 2007 Jun 4-24 | 11 | 64 | 23 | 2 | * |
| 2006 Jun 8-25 | 10 | 57 | 26 | 6 | 2 |
| 2005 Jun 6-25 | 11 | 61 | 22 | 5 | 1 |
| 2004 Jun 9-30 | 13 | 61 | 20 | 5 | 1 |
| 2003 Jun 12-15 | 10 | 59 | 25 | 5 | 1 |
| 2002 Jun 3-6 | 7 | 63 | 24 | 3 | 3 |
| 2001 Jun 11-17 | 6 | 56 | 30 | 6 | 2 |
| Black adults | |||||
| 2021 Jun 1-Jul 5 | 4 | 29 | 35 | 31 | -- |
| 2020 Jun 8-Jul 24 | 4 | 32 | 29 | 34 | 1 |
| 2018 Nov 19-Dec 22 | 5 | 35 | 29 | 30 | 1 |
| 2016 Jun 7-Jul 1 | 7 | 42 | 29 | 21 | * |
| 2015 Jun 15-Jul 10 | 10 | 41 | 24 | 24 | * |
| 2013 Jun 13-Jul 5 | 8 | 58 | 24 | 9 | 1 |
| 2008 Jun 5-Jul 6 | 7 | 54 | 23 | 14 | 1 |
| 2007 Jun 4-24 | 7 | 48 | 31 | 12 | 2 |
| 2006 Jun 8-25 | 7 | 55 | 22 | 14 | 2 |
| 2005 Jun 6-25 | 10 | 55 | 20 | 13 | 2 |
| 2004 Jun 9-30 | 12 | 56 | 21 | 8 | 3 |
| 2003 Jun 12-18 | 9 | 50 | 26 | 13 | 2 |
| 2002 Jun 3-9 | 9 | 59 | 18 | 13 | 1 |
| 2001 Jun 11-17 | 8 | 62 | 17 | 11 | 2 |
| Hispanic adults | |||||
| 2021 Jun 1-Jul 5 | 9 | 36 | 37 | 19 | * |
| 2018 Nov 19-Dec 22 | 11 | 41 | 27 | 20 | 1 |
| 2016 Jun 7-Jul 1 | 9 | 44 | 29 | 16 | 2 |
| 2015 Jun 15-Jul 10 | 10 | 37 | 32 | 20 | * |
| 2013 Jun 13-Jul 5 | 12 | 52 | 28 | 8 | 1 |
| 2008 Jun 5-Jul 6 | 7 | 50 | 27 | 10 | 6 |
| 2007 Jun 4-24 | 9 | 50 | 25 | 10 | 6 |
| 2006 Jun 8-25 | 10 | 48 | 24 | 14 | 5 |
| 2005 Jun 6-25 | 11 | 47 | 27 | 11 | 4 |
| 2004 Jun 9-30 | 12 | 49 | 21 | 10 | 8 |
| 2003 Jun 12-18 | 11 | 57 | 19 | 9 | 4 |
| 2002 Jun 3-9 | 9 | 53 | 25 | 9 | 4 |
| 2001 Jun 11-17 | 8 | 57 | 18 | 14 | 3 |
| * Less than 0.5% | |||||
| Gallup | |||||
Next, I'm going to read a list of problems facing the country. For each one, please tell me if you personally worry about this problem a great deal, a fair amount, only a little or not at all. How much do you personally worry about race relations?
| Great deal | Fair amount | Only a little | Not at all | No opinion | |
|---|---|---|---|---|---|
| % | % | % | % | % | |
| 2024 Mar 1-20 | 35 | 29 | 22 | 14 | 1 |
| 2023 Mar 1-23 | 38 | 27 | 21 | 14 | * |
| 2022 Mar 1-18 | 41 | 29 | 17 | 13 | * |
| 2021 Mar 1-15 | 48 | 25 | 16 | 11 | * |
| 2020 Mar 2-13 | 31 | 27 | 23 | 19 | 1 |
| 2019 Mar 1-10 | 40 | 26 | 17 | 17 | 1 |
| 2018 Mar 1-8 | 37 | 27 | 18 | 17 | 1 |
| 2017 Mar 1-5 | 42 | 27 | 17 | 12 | 1 |
| 2016 Mar 2-6 | 35 | 27 | 20 | 17 | * |
| 2015 Mar 5-8 | 28 | 27 | 24 | 20 | 1 |
| 2014 Mar 6-9 ^ | 17 | 26 | 29 | 27 | 1 |
| 2013 Mar 7-10 | 18 | 26 | 30 | 23 | 2 |
| 2012 Mar 8-11 | 17 | 27 | 30 | 25 | 1 |
| 2011 Mar 3-6 | 16 | 28 | 29 | 25 | 1 |
| 2010 Mar 4-7 | 13 | 28 | 33 | 26 | 1 |
| 2008 Mar 6-9 | 18 | 27 | 31 | 23 | 1 |
| 2007 Mar 11-14 | 19 | 32 | 30 | 18 | 1 |
| 2006 Mar 13-16 | 22 | 36 | 23 | 19 | * |
| 2005 Mar 7-10 | 16 | 21 | 36 | 26 | 1 |
| 2004 Mar 8-11 | 19 | 23 | 34 | 23 | 1 |
| 2003 Mar 24-25 | 22 | 31 | 26 | 21 | * |
| 2002 Mar 4-7 | 23 | 25 | 30 | 21 | 1 |
| 2001 Mar 5-7 | 28 | 34 | 23 | 15 | * |
| ^ Asked of a half sample; * Less than 0.5% | |||||
| Gallup | |||||
Next, we'd like to know how you feel about the state of the nation in each of the following areas. For each one, please say whether you are -- very satisfied, somewhat satisfied, somewhat dissatisfied or very dissatisfied. If you don't have enough information about a particular subject to rate it, just say so. How about -- the state of race relations?
| Very satisfied | Somewhat satisfied | Somewhat dissatisfied | Very dissatisfied | No opinion | |
|---|---|---|---|---|---|
| % | % | % | % | % | |
| 2024 | 7 | 23 | 33 | 27 | 10 |
| 2023 | 7 | 24 | 31 | 30 | 8 |
| 2022 | 7 | 21 | 30 | 38 | 4 |
| 2021 | 7 | 16 | 25 | 46 | 6 |
| 2020 | 7 | 29 | 33 | 25 | 6 |
| 2019 | 8 | 22 | 31 | 33 | 7 |
| 2018 | 6 | 23 | 28 | 36 | 7 |
| 2017 | 5 | 17 | 31 | 41 | 6 |
| 2016 | 3 | 24 | 30 | 34 | 9 |
| 2015 | 6 | 24 | 32 | 30 | 8 |
| 2014 | 10 | 45 | 24 | 11 | 10 |
| 2013 | 11 | 39 | 27 | 14 | 9 |
| 2012 | 10 | 41 | 26 | 14 | 9 |
| 2008 | 8 | 43 | 28 | 12 | 9 |
| 2007 | 10 | 40 | 29 | 13 | 8 |
| 2006 | 10 | 42 | 27 | 13 | 7 |
| 2005 | 9 | 44 | 24 | 13 | 10 |
| 2004 | 9 | 45 | 30 | 10 | 6 |
| 2003 | 8 | 41 | 30 | 14 | 7 |
| 2002 | 8 | 45 | 28 | 13 | 6 |
| 2001 | 5 | 39 | 34 | 14 | 8 |
| Gallup | |||||
Next, we'd like to know how you feel about the state of the nation in each of the following areas. For each one, please say whether you are -- very satisfied, somewhat satisfied, somewhat dissatisfied or very dissatisfied. If you don't have enough information about a particular subject to rate it, just say so. How about -- the position of Blacks and other racial minorities in the nation?
| Very satisfied | Somewhat satisfied | Somewhat dissatisfied | Very dissatisfied | No opinion | |
|---|---|---|---|---|---|
| % | % | % | % | % | |
| 2024 Jan 2-22 | 12 | 31 | 27 | 17 | 13 |
| 2023 Jan 2-22 | 11 | 30 | 27 | 22 | 10 |
| 2022 Jan 3-16 | 11 | 29 | 28 | 25 | 7 |
| 2021 Jan 4-15 | 9 | 26 | 22 | 34 | 10 |
| 2020 Jan 2-15 | 16 | 30 | 23 | 23 | 8 |
| 2019 Jan 2-10 | 13 | 30 | 23 | 26 | 7 |
| 2018 Jan 2-7 | 11 | 28 | 24 | 29 | 8 |
| 2017 Jan 4-8 | 9 | 28 | 28 | 24 | 10 |
| 2016 Jan 6-10 | 8 | 35 | 27 | 18 | 12 |
| 2008 Jan 4-6 | 14 | 44 | 24 | 10 | 9 |
| 2007 Jan 15-18 | 13 | 42 | 25 | 12 | 8 |
| 2006 Jan 9-12 | 13 | 40 | 22 | 13 | 11 |
| 2005 Jan 3-5 | 15 | 42 | 23 | 12 | 8 |
| 2004 Jan 12-15 | 12 | 45 | 25 | 11 | 7 |
| 2003 Jan 13-16 | 11 | 45 | 25 | 11 | 8 |
| 2002 Jan 7-9 | 12 | 46 | 24 | 12 | 6 |
| 2001 Jan 10-14 | 10 | 43 | 27 | 13 | 7 |
| Gallup | |||||
Next, we'd like to know how you would rate relations between various groups in the United States these days. Would you say relations between -- White and Hispanic people -- are very good, somewhat good, somewhat bad or very bad?
| Very good | Somewhat good | Somewhat bad | Very bad | No opinion | |
|---|---|---|---|---|---|
| % | % | % | % | % | |
| National adults | |||||
| 2021 Jun 1-Jul 5 | 14 | 48 | 27 | 11 | 1 |
| 2020 Jun 8-Jul 24 | 10 | 52 | 27 | 10 | 1 |
| 2018 Nov 19-Dec 22 | 13 | 49 | 27 | 9 | 2 |
| 2016 Jun 7-Jul 1 | 11 | 55 | 26 | 7 | 2 |
| 2015 Jun 15-Jul 10 | 14 | 55 | 25 | 4 | 1 |
| 2013 Jun 13-Jul 5 | 13 | 57 | 24 | 5 | 1 |
| 2008 Jun 5-Jul 6 | 10 | 55 | 27 | 6 | 2 |
| 2007 Jun 4-24 | 9 | 57 | 21 | 7 | 6 |
| 2006 Jun 8-25 | 13 | 47 | 30 | 7 | 3 |
| 2005 Jun 6-25 | 11 | 59 | 23 | 3 | 4 |
| 2004 Jun 9-30 | 13 | 61 | 19 | 4 | 3 |
| 2003 Jun 12-18 | 12 | 61 | 20 | 4 | 3 |
| 2002 Jun 3-9 | 7 | 61 | 22 | 5 | 5 |
| 2001 Jun 11-17 | 7 | 59 | 26 | 4 | 4 |
| White adults | |||||
| 2021 Jun 1-Jul 5 | 14 | 50 | 26 | 9 | 1 |
| 2020 Jun 8-Jul 24 | 10 | 53 | 28 | 8 | 1 |
| 2018 Nov 19-Dec 22 | 14 | 51 | 26 | 6 | 2 |
| 2016 Jun 7-Jul 1 | 11 | 57 | 24 | 6 | 2 |
| 2015 Jun 15-Jul 10 | 13 | 56 | 26 | 3 | 1 |
| 2013 Jun 13-Jul 5 | 14 | 58 | 24 | 4 | 1 |
| 2008 Jun 5-Jul 6 | 9 | 56 | 30 | 5 | 1 |
| 2007 Jun 4-24 | 9 | 59 | 19 | 6 | 6 |
| 2006 Jun 8-25 | 13 | 48 | 32 | 4 | 3 |
| 2005 Jun 6-25 | 10 | 63 | 24 | 1 | 2 |
| 2004 Jun 9-30 | 12 | 62 | 20 | 4 | 2 |
| 2003 Jun 12-15 | 11 | 61 | 22 | 3 | 3 |
| 2002 Jun 3-6 | 7 | 61 | 23 | 4 | 5 |
| 2001 Jun 11-17 | 6 | 61 | 25 | 4 | 4 |
| Black adults | |||||
| 2021 Jun 1-Jul 5 | 8 | 45 | 30 | 15 | 1 |
| 2020 Jun 8-Jul 24 | 5 | 38 | 32 | 23 | 2 |
| 2018 Nov 19-Dec 22 | 6 | 37 | 34 | 20 | 2 |
| 2016 Jun 7-Jul 1 | 9 | 45 | 30 | 13 | 3 |
| 2015 Jun 15-Jul 10 | 10 | 53 | 26 | 9 | 2 |
| 2013 Jun 13-Jul 5 | 10 | 53 | 25 | 10 | 2 |
| 2008 Jun 5-Jul 6 | 10 | 48 | 24 | 10 | 7 |
| 2007 Jun 4-24 | 8 | 45 | 29 | 12 | 6 |
| 2006 Jun 8-25 | 9 | 46 | 26 | 14 | 5 |
| 2005 Jun 6-25 | 11 | 50 | 22 | 6 | 11 |
| 2004 Jun 9-30 | 12 | 50 | 22 | 4 | 12 |
| 2003 Jun 12-18 | 9 | 52 | 24 | 6 | 9 |
| 2002 Jun 3-9 | 8 | 52 | 21 | 11 | 8 |
| 2001 Jun 11-17 | 7 | 48 | 28 | 9 | 8 |
| Hispanic adults | |||||
| 2021 Jun 1-Jul 5 | 17 | 47 | 24 | 12 | -- |
| 2018 Nov 19-Dec 22 | 15 | 49 | 23 | 12 | 1 |
| 2016 Jun 7-Jul 1 | 12 | 55 | 25 | 8 | 1 |
| 2015 Jun 15-Jul 10 | 18 | 55 | 22 | 6 | * |
| 2013 Jun 13-Jul 5 | 12 | 59 | 22 | 6 | 2 |
| 2008 Jun 5-Jul 6 | 12 | 59 | 17 | 9 | 3 |
| 2007 Jun 4-24 | 15 | 55 | 22 | 6 | 2 |
| 2006 Jun 8-25 | 16 | 52 | 17 | 12 | 3 |
| 2005 Jun 6-25 | 16 | 51 | 21 | 10 | 2 |
| 2004 Jun 9-30 | 20 | 56 | 16 | 3 | 5 |
| 2003 Jun 12-18 | 16 | 68 | 10 | 5 | 1 |
| 2002 Jun 3-9 | 10 | 66 | 14 | 6 | 4 |
| 2001 Jun 11-17 | 14 | 55 | 21 | 7 | 3 |
| * Less than 0.5% | |||||
| Gallup | |||||
Next, we'd like to know how you would rate relations between various groups in the United States these days. Would you say relations between -- White and Asian people -- are very good, somewhat good, somewhat bad or very bad?
| Very good | Somewhat good | Somewhat bad | Very bad | No opinion | |
|---|---|---|---|---|---|
| % | % | % | % | % | |
| National adults | |||||
| 2021 Jun 1-Jul 5 | 19 | 48 | 24 | 7 | 2 |
| 2020 Jun 8-Jul 24 | 20 | 58 | 17 | 4 | 1 |
| 2018 Nov 19-Dec 22 | 24 | 58 | 12 | 2 | 4 |
| 2016 Jun 7-Jul 1 | 27 | 59 | 9 | 2 | 4 |
| 2015 Jun 15-Jul 10 | 28 | 58 | 9 | 1 | 3 |
| 2013 Jun 13-Jul 5 | 30 | 57 | 9 | 1 | 3 |
| 2008 Jun 5-Jul 6 | 23 | 58 | 10 | 2 | 7 |
| 2007 Jun 4-24 | 24 | 56 | 8 | 2 | 10 |
| 2006 Jun 8-25 | 27 | 56 | 10 | 2 | 5 |
| 2005 Jun 6-25 | 20 | 59 | 12 | 1 | 8 |
| 2004 Jun 9-30 | 23 | 58 | 9 | 4 | 6 |
| 2003 Jun 12-18 | 20 | 62 | 11 | 2 | 5 |
| 2002 Jun 3-9 | 14 | 63 | 14 | 2 | 7 |
| 2001 Jun 11-17 | 14 | 62 | 15 | 4 | 5 |
| White adults | |||||
| 2021 Jun 1-Jul 5 | 20 | 48 | 24 | 7 | 2 |
| 2020 Jun 8-Jul 24 | 22 | 59 | 15 | 3 | 1 |
| 2018 Nov 19-Dec 22 | 27 | 58 | 10 | 2 | 4 |
| 2016 Jun 7-Jul 1 | 29 | 60 | 7 | 1 | 4 |
| 2015 Jun 15-Jul 10 | 30 | 59 | 8 | 1 | 2 |
| 2013 Jun 13-Jul 5 | 33 | 56 | 7 | 1 | 3 |
| 2008 Jun 5-Jul 6 | 24 | 59 | 10 | 1 | 5 |
| 2007 Jun 4-24 | 26 | 57 | 7 | * | 10 |
| 2006 Jun 8-25 | 30 | 57 | 9 | 1 | 3 |
| 2005 Jun 6-25 | 21 | 60 | 13 | * | 6 |
| 2004 Jun 9-30 | 24 | 60 | 9 | 4 | 3 |
| 2003 Jun 12-15 | 19 | 64 | 11 | 2 | 4 |
| 2002 Jun 3-6 | 13 | 64 | 15 | 2 | 6 |
| 2001 Jun 11-17 | 13 | 64 | 16 | 2 | 5 |
| Black adults | |||||
| 2021 Jun 1-Jul 5 | 14 | 47 | 29 | 10 | * |
| 2020 Jun 8-Jul 24 | 14 | 56 | 21 | 6 | 3 |
| 2018 Nov 19-Dec 22 | 17 | 57 | 17 | 5 | 5 |
| 2016 Jun 7-Jul 1 | 21 | 59 | 12 | 2 | 5 |
| 2015 Jun 15-Jul 10 | 23 | 57 | 12 | 4 | 3 |
| 2013 Jun 13-Jul 5 | 23 | 61 | 9 | 2 | 5 |
| 2008 Jun 5-Jul 6 | 17 | 56 | 12 | 5 | 10 |
| 2007 Jun 4-24 | 15 | 54 | 15 | 6 | 10 |
| 2006 Jun 8-25 | 18 | 52 | 17 | 4 | 10 |
| 2005 Jun 6-25 | 16 | 56 | 11 | 3 | 14 |
| 2004 Jun 9-30 | 16 | 52 | 13 | 4 | 15 |
| 2003 Jun 12-18 | 19 | 55 | 15 | 2 | 9 |
| 2002 Jun 3-9 | 12 | 60 | 13 | 5 | 10 |
| 2001 Jun 11-17 | 14 | 52 | 20 | 4 | 10 |
| Hispanic adults | |||||
| 2021 Jun 1-Jul 5 | 16 | 52 | 22 | 8 | 2 |
| 2018 Nov 19-Dec 22 | 19 | 60 | 14 | 3 | 3 |
| 2016 Jun 7-Jul 1 | 20 | 57 | 12 | 3 | 9 |
| 2015 Jun 15-Jul 10 | 26 | 56 | 13 | 1 | 4 |
| 2013 Jun 13-Jul 5 | 20 | 62 | 12 | 2 | 4 |
| 2008 Jun 5-Jul 6 | 18 | 53 | 10 | 4 | 15 |
| 2007 Jun 4-24 | 18 | 54 | 10 | 3 | 15 |
| 2006 Jun 8-25 | 22 | 51 | 8 | 9 | 10 |
| 2005 Jun 6-25 | 17 | 56 | 11 | 5 | 11 |
| 2004 Jun 9-30 | 25 | 47 | 8 | 5 | 15 |
| 2003 Jun 12-18 | 19 | 57 | 9 | 3 | 12 |
| 2002 Jun 3-9 | 18 | 56 | 11 | 4 | 11 |
| 2001 Jun 11-17 | 8 | 57 | 18 | 8 | 9 |
| * Less than 0.5% | |||||
| Gallup | |||||
Next, we'd like to know how you would rate relations between various groups in the United States these days. Would you say relations between -- Black and Hispanic people -- are very good, somewhat good, somewhat bad or very bad?
| Very good | Somewhat good | Somewhat bad | Very bad | No opinion | |
|---|---|---|---|---|---|
| % | % | % | % | % | |
| National adults | |||||
| 2021 Jun 1-Jul 5 | 11 | 56 | 24 | 7 | 2 |
| 2020 Jun 8-Jul 24 | 12 | 54 | 24 | 6 | 4 |
| 2018 Nov 19-Dec 22 | 12 | 52 | 23 | 5 | 7 |
| 2016 Jun 7-Jul 1 | 10 | 54 | 21 | 5 | 9 |
| 2015 Jun 15-Jul 10 | 11 | 49 | 30 | 6 | 4 |
| 2013 Jun 13-Jul 5 | 10 | 50 | 26 | 6 | 7 |
| 2008 Jun 5-Jul 6 | 7 | 42 | 29 | 11 | 11 |
| 2007 Jun 4-24 | 6 | 43 | 27 | 9 | 15 |
| 2006 Jun 8-25 | 9 | 39 | 29 | 8 | 15 |
| 2005 Jun 6-25 | 9 | 47 | 26 | 5 | 13 |
| 2004 Jun 9-30 | 9 | 53 | 20 | 6 | 12 |
| 2003 Jun 12-18 | 10 | 50 | 26 | 4 | 10 |
| 2002 Jun 3-9 | 7 | 46 | 26 | 7 | 14 |
| 2001 Jun 11-17 | 6 | 43 | 30 | 9 | 12 |
| White adults | |||||
| 2021 Jun 1-Jul 5 | 8 | 54 | 26 | 7 | 3 |
| 2020 Jun 8-Jul 24 | 9 | 52 | 27 | 6 | 6 |
| 2018 Nov 19-Dec 22 | 9 | 51 | 25 | 5 | 10 |
| 2016 Jun 7-Jul 1 | 7 | 52 | 23 | 5 | 12 |
| 2015 Jun 15-Jul 10 | 8 | 46 | 36 | 6 | 5 |
| 2013 Jun 13-Jul 5 | 8 | 48 | 28 | 7 | 10 |
| 2008 Jun 5-Jul 6 | 5 | 38 | 31 | 12 | 14 |
| 2007 Jun 4-24 | 4 | 42 | 28 | 7 | 19 |
| 2006 Jun 8-25 | 8 | 33 | 34 | 6 | 19 |
| 2005 Jun 6-25 | 7 | 46 | 28 | 4 | 15 |
| 2004 Jun 9-30 | 6 | 52 | 21 | 6 | 15 |
| 2003 Jun 12-15 | 7 | 48 | 29 | 4 | 12 |
| 2002 Jun 3-6 | 4 | 42 | 30 | 7 | 17 |
| 2001 Jun 11-17 | 4 | 38 | 34 | 10 | 14 |
| Black adults | |||||
| 2021 Jun 1-Jul 5 | 14 | 64 | 18 | 4 | -- |
| 2020 Jun 8-Jul 24 | 17 | 61 | 16 | 6 | 1 |
| 2018 Nov 19-Dec 22 | 19 | 54 | 19 | 6 | 1 |
| 2016 Jun 7-Jul 1 | 20 | 63 | 12 | 4 | 1 |
| 2015 Jun 15-Jul 10 | 17 | 62 | 14 | 6 | 1 |
| 2013 Jun 13-Jul 5 | 17 | 59 | 18 | 4 | 2 |
| 2008 Jun 5-Jul 6 | 13 | 54 | 19 | 10 | 4 |
| 2007 Jun 4-24 | 12 | 56 | 20 | 9 | 4 |
| 2006 Jun 8-25 | 9 | 62 | 16 | 11 | 3 |
| 2005 Jun 6-25 | 18 | 59 | 12 | 4 | 7 |
| 2004 Jun 9-30 | 18 | 59 | 14 | 3 | 6 |
| 2003 Jun 12-18 | 17 | 55 | 19 | 4 | 5 |
| 2002 Jun 3-9 | 14 | 59 | 18 | 5 | 4 |
| 2001 Jun 11-17 | 18 | 56 | 17 | 5 | 4 |
| Hispanic adults | |||||
| 2021 Jun 1-Jul 5 | 20 | 52 | 22 | 7 | -- |
| 2018 Nov 19-Dec 22 | 16 | 56 | 19 | 8 | 1 |
| 2016 Jun 7-Jul 1 | 14 | 56 | 18 | 7 | 4 |
| 2015 Jun 15-Jul 10 | 18 | 50 | 23 | 6 | 2 |
| 2013 Jun 13-Jul 5 | 10 | 54 | 28 | 6 | 2 |
| 2008 Jun 5-Jul 6 | 10 | 50 | 26 | 10 | 4 |
| 2007 Jun 4-24 | 15 | 44 | 29 | 9 | 4 |
| 2006 Jun 8-25 | 15 | 46 | 21 | 13 | 5 |
| 2005 Jun 6-25 | 12 | 44 | 26 | 14 | 4 |
| 2004 Jun 9-30 | 17 | 51 | 16 | 9 | 7 |
| 2003 Jun 12-18 | 16 | 55 | 19 | 7 | 3 |
| 2002 Jun 3-9 | 13 | 58 | 16 | 7 | 6 |
| 2001 Jun 11-17 | 16 | 53 | 22 | 5 | 4 |
| * Less than 0.5% | |||||
| Gallup | |||||
Next, we'd like to know how you would rate relations between various groups in the United States these days. Would you say relations between -- Black and Asian people -- are very good, somewhat good, somewhat bad or very bad?
| Very good | Somewhat good | Somewhat bad | Very bad | No opinion | |
|---|---|---|---|---|---|
| % | % | % | % | % | |
| National adults | |||||
| 2021 Jun 1-Jul 5 | 9 | 49 | 28 | 10 | 3 |
| 2020 Jun 8-Jul 24 | 10 | 58 | 23 | 5 | 5 |
| 2018 Nov 19-Dec 22 | 12 | 54 | 19 | 4 | 11 |
| 2016 Jun 7-Jul 1 | 12 | 54 | 18 | 3 | 13 |
| 2015 Jun 15-Jul 10 | 11 | 55 | 23 | 4 | 7 |
| White adults | |||||
| 2021 Jun 1-Jul 5 | 8 | 48 | 29 | 10 | 4 |
| 2020 Jun 8-Jul 24 | 10 | 58 | 22 | 4 | 6 |
| 2018 Nov 19-Dec 22 | 11 | 53 | 19 | 3 | 14 |
| 2016 Jun 7-Jul 1 | 11 | 53 | 19 | 3 | 15 |
| 2015 Jun 15-Jul 10 | 10 | 55 | 25 | 3 | 8 |
| Black adults | |||||
| 2021 Jun 1-Jul 5 | 12 | 48 | 30 | 8 | * |
| 2020 Jun 8-Jul 24 | 8 | 57 | 26 | 8 | 2 |
| 2018 Nov 19-Dec 22 | 12 | 57 | 19 | 8 | 4 |
| 2016 Jun 7-Jul 1 | 16 | 63 | 13 | 5 | 4 |
| 2015 Jun 15-Jul 10 | 13 | 61 | 17 | 6 | 3 |
| Hispanic adults | |||||
| 2021 Jun 1-Jul 5 | 12 | 51 | 27 | 8 | 2 |
| 2018 Nov 19-Dec 22 | 13 | 59 | 16 | 5 | 7 |
| 2016 Jun 7-Jul 1 | 12 | 53 | 17 | 5 | 12 |
| 2015 Jun 15-Jul 10 | 15 | 52 | 20 | 6 | 7 |
| * Less than 0.5% | |||||
| Gallup | |||||
Do you think that relations between Black and White people will always be a problem for the United States, or that a solution will eventually be worked out?
| Always a problem | Eventually worked out | No opinion | |
|---|---|---|---|
| % | % | % | |
| National adults | |||
| 2021 Jun 1-Jul 5 | 40 | 57 | 3 |
| 2020 Jun 8-Jul 24 | 39 | 59 | 2 |
| 2018 Nov 19-Dec 22 | 39 | 57 | 4 |
| 2016 Jul 13-17 | 37 | 58 | 5 |
| 2016 Jun 7-Jul 1 | 40 | 57 | 2 |
| 2015 Jun 15-Jul 10 | 41 | 58 | 1 |
| 2013 Jun 13-Jul 5 | 40 | 58 | 3 |
| 2011 Aug 4-7 | 46 | 52 | 2 |
| 2009 Oct 16-19 | 40 | 56 | 4 |
| 2008 Nov 5 | 30 | 67 | 3 |
| 2008 Jun 5-Jul 6 | 38 | 58 | 3 |
| 2008 May 1-3 | 42 | 54 | 4 |
| 2007 Jun 4-24 | 43 | 54 | 4 |
| 2006 Jun 8-25 | 42 | 54 | 4 |
| 2005 Jun 6-25 | 46 | 50 | 4 |
| 2004 Jun 9-30 | 45 | 51 | 4 |
| 2002 Dec 9-2003 Feb 11 | 47 | 50 | 3 |
| 2001 Mar 23-May 16 | 47 | 48 | 5 |
| 1999 Sep 24-Nov 16 | 52 | 44 | 4 |
| 1998 Aug 13-Oct 26 | 56 | 41 | 3 |
| 1997 Jan 4-Feb 28 | 55 | 42 | 3 |
| 1995 Oct 19-22 | 68 | 29 | 3 |
| 1995 Oct 5-7 | 54 | 41 | 5 |
| 1993 Aug 23-25 | 53 | 44 | 3 |
| 1963 Dec ^ | 42 | 55 | 3 |
| White adults | |||
| 2021 Jun 1-Jul 5 | 38 | 60 | 2 |
| 2020 Jun 8-Jul 24 | 36 | 62 | 2 |
| 2018 Nov 19-Dec 22 | 38 | 58 | 4 |
| 2016 Jun 7-Jul 1 | 41 | 57 | 2 |
| 2015 Jun 15-Jul 10 | 39 | 59 | 2 |
| 2013 Jun 13-Jul 5 | 39 | 58 | 3 |
| 2011 Aug 4-7 | 44 | 54 | 2 |
| 2009 Oct 16-19 | 38 | 58 | 4 |
| 2008 Jun 5-Jul 6 | 37 | 59 | 4 |
| 2007 Jun 4-24 | 41 | 55 | 4 |
| 2006 Jun 8-25 | 40 | 56 | 4 |
| 2005 Jun 6-25 | 46 | 51 | 3 |
| 2004 Jun 9-30 | 44 | 52 | 4 |
| 2002 Dec 9-2003 Feb 11 | 46 | 51 | 3 |
| 2001 Mar 23-May 16 | 45 | 50 | 5 |
| 1999 Sep 24-Nov 16 | 51 | 45 | 4 |
| 1998 Aug 13-Oct 26 | 57 | 41 | 2 |
| 1997 Jan 4-Feb 28 | 54 | 42 | 4 |
| 1995 Oct 19-22 | 68 | 29 | 3 |
| 1995 Oct 5-7 | 55 | 40 | 5 |
| 1993 Aug 23-25 | 53 | 44 | 3 |
| 1963 Dec ^ | 44 | 53 | 3 |
| Black adults | |||
| 2021 Jun 1-Jul 5 | 59 | 40 | 1 |
| 2020 Jun 8-Jul 24 | 45 | 54 | 1 |
| 2018 Nov 19-Dec 22 | 53 | 44 | 3 |
| 2016 Jun 7-Jul 1 | 51 | 48 | 1 |
| 2015 Jun 15-Jul 10 | 56 | 43 | 1 |
| 2013 Aug 9-22 | 50 | 48 | 2 |
| 2013 Jun 13-Jul 5 | 49 | 48 | 2 |
| 2011 Aug 4-7 | 55 | 42 | 2 |
| 2009 Oct 16-19 | 55 | 42 | 3 |
| 2008 Jun 5-Jul 6 | 49 | 50 | 2 |
| 2007 Jun 4-24 | 56 | 41 | 3 |
| 2006 Jun 8-25 | 55 | 43 | 2 |
| 2005 Jun 6-25 | 57 | 41 | 2 |
| 2004 Jun 9-30 | 57 | 41 | 2 |
| 2002 Dec 9-2003 Feb 11 | 59 | 39 | 2 |
| 2001 Mar 23-May 16 | 66 | 32 | 2 |
| 1999 Sep 24-Nov 16 | 59 | 36 | 5 |
| 1998 Aug 13-Oct 26 | 58 | 38 | 4 |
| 1997 Jan 4-Feb 28 | 58 | 38 | 4 |
| 1995 Oct 19-22 | 64 | 33 | 3 |
| 1995 Oct 5-7 | 55 | 41 | 4 |
| 1993 Aug 23-25 | 55 | 44 | 1 |
| 1963 Dec ^ | 26 | 70 | 4 |
| Hispanic adults | |||
| 2021 Jun 1-Jul 5 | 34 | 63 | 3 |
| 2018 Nov 19-Dec 22 | 36 | 60 | 4 |
| 2016 Jun 7-Jul 1 | 31 | 66 | 3 |
| 2015 Jun 15-Jul 10 | 35 | 64 | 1 |
| 2013 Jun 13-Jul 5 | 35 | 63 | 2 |
| 2008 Jun 5-Jul 6 | 38 | 58 | 3 |
| 2007 Jun 4-24 | 43 | 54 | 3 |
| 2006 Jun 8-25 | 32 | 63 | 5 |
| 2005 Jun 6-25 | 42 | 51 | 7 |
| 2004 Jun 9-30 | 42 | 53 | 5 |
| ^ NORC poll. NOTES: Trends for Whites and Blacks from 2004-present exclude White and Black Hispanics; trends for Whites and Blacks from 1963-2002 include White and Black Hispanics. | |||
| Gallup | |||
Do you approve or disapprove of marriage between Black people and White people?
| Approve | Disapprove | No opinion | |
|---|---|---|---|
| % | % | % | |
| National adults | |||
| 2021 Jul 6-21 | 94 | 4 | 2 |
| 2013 Jun 13-Jul 5 | 87 | 11 | 2 |
| 2011 Aug 4-7 | 86 | 11 | 3 |
| 2007 Sep 7-8 | 79 | 15 | 6 |
| 2007 Jun 4-24 | 77 | 17 | 6 |
| 2004 Jun 9-30 | 76 | 19 | 5 |
| 2003 Nov 11-Dec 14 | 73 | 23 | 4 |
| 2002 Jun 3-9 | 65 | 29 | 6 |
| 1997 Jan 4-Feb 28 | 64 | 27 | 9 |
| 1994 Sep 18-20 | 48 | 37 | 15 |
| 1991 Jun 13-16 | 48 | 42 | 10 |
| 1983 Apr 29-May 2 | 43 | 50 | 7 |
| 1978 Jul 21-24 ^ | 36 | 54 | 10 |
| 1972 Oct 13-16 ^ | 29 | 60 | 11 |
| 1968 Jun 26-Jul 1 ^ | 20 | 73 | 8 |
| 1958 Sep 24-29 # | 4 | 94 | 3 |
| White adults | |||
| 2013 Jun 13-Jul 5 | 84 | 13 | 2 |
| 2011 Aug 4-7 | 83 | 14 | 3 |
| 2007 Jun 4-24 | 75 | 20 | 6 |
| 2004 Jun 9-30 | 72 | 23 | 5 |
| 2003 Nov 11-Dec 14 | 70 | 27 | 3 |
| 2002 Jun 3-6 | 60 | 33 | 7 |
| 1997 Jan 4-Feb 28 | 61 | 30 | 9 |
| 1994 Sep 18-20 | 45 | 41 | 14 |
| 1991 Jun 13-16 | 44 | 45 | 11 |
| 1983 Apr 29-May 2 | 38 | 56 | 6 |
| 1978 Jul 21-24 ^ | 33 | 58 | 9 |
| 1972 Oct 13-16 ^ | 25 | 65 | 10 |
| 1968 Jun 26-Jul 1 ^ | 17 | 75 | 7 |
| 1958 Sep 24-29 # | 4 | 94 | 3 |
| Black adults | |||
| 2013 Jun 13-Jul 5 | 96 | 3 | 1 |
| 2011 Aug 4-7 | 96 | 2 | 2 |
| 2007 Jun 4-24 | 85 | 10 | 4 |
| 2004 Jun 9-30 | 87 | 9 | 4 |
| 2003 Nov 11-Dec 14 | 80 | 16 | 4 |
| 2002 Jun 3-9 | 78 | 20 | 2 |
| 1997 Jan 4-Feb 28 | 77 | 16 | 7 |
| 1994 Sep 18-20 | 68 | 19 | 13 |
| 1991 Jun 13-16 | 70 | 19 | 11 |
| 1983 Apr 29-May 2 | 71 | 21 | 9 |
| 1978 Jul 21-24 ^ | 66 | 19 | 15 |
| 1972 Oct 13-16 ^ | 61 | 21 | 19 |
| 1968 Jun 26-Jul 1 ^ | 56 | 33 | 11 |
| ^ WORDING: "... marriage between Whites and non-Whites?"; # WORDING: "... marriage between White and Colored people?" NOTE: Results for Black and White adults shown only for polls that included an oversample of Black respondents. | |||
| Gallup | |||
Next, we'd like to know how you feel about the way various groups in society are treated. For each of the following groups, please say whether you are very satisfied, somewhat satisfied, somewhat dissatisfied or very dissatisfied with the way they are treated. How about … Immigrants?
| Very satisfied | Somewhat satisfied | Somewhat dissatisfied | Very dissatisfied | No opinion | |
|---|---|---|---|---|---|
| % | % | % | % | % | |
| National adults | |||||
| 2021 Jun 1-Jul 5 | 9 | 24 | 26 | 40 | 1 |
| 2020 Jun 8-Jul 24 | 11 | 26 | 22 | 40 | 1 |
| 2018 Nov 19-Dec 22 | 16 | 21 | 22 | 37 | 2 |
| 2016 Jun 7-Jul 1 | 13 | 30 | 32 | 23 | 2 |
| 2015 Jun 15-Jul 10 | 14 | 30 | 33 | 21 | 1 |
| 2013 Jun 13-Jul 5 | 12 | 34 | 28 | 22 | 3 |
| 2008 Jun 5-Jul 6 | 13 | 33 | 27 | 23 | 5 |
| 2007 Jun 4-24 | 12 | 31 | 29 | 21 | 7 |
| 2006 Jun 8-25 | 14 | 33 | 26 | 21 | 5 |
| 2005 Jun 6-25 | 13 | 41 | 26 | 16 | 4 |
| 2003 Jun 12-18 | 15 | 43 | 25 | 13 | 4 |
| 2002 Jun 3-9 | 16 | 39 | 25 | 14 | 6 |
| 2001 Jun 11-17 | 14 | 40 | 27 | 14 | 5 |
| White adults | |||||
| 2021 Jun 1-Jul 5 | 10 | 27 | 27 | 35 | 2 |
| 2020 Jun 8-Jul 24 | 12 | 31 | 22 | 33 | 1 |
| 2018 Nov 19-Dec 22 | 18 | 25 | 23 | 30 | 4 |
| 2016 Jun 7-Jul 1 | 14 | 32 | 33 | 18 | 3 |
| 2015 Jun 15-Jul 10 | 16 | 31 | 32 | 19 | 1 |
| 2013 Jun 13-Jul 5 | 13 | 37 | 27 | 20 | 3 |
| 2008 Jun 5-Jul 6 | 14 | 35 | 27 | 18 | 6 |
| 2007 Jun 4-24 | 12 | 36 | 27 | 17 | 8 |
| 2006 Jun 8-25 | 16 | 36 | 27 | 16 | 6 |
| 2005 Jun 6-25 | 14 | 46 | 25 | 12 | 3 |
| 2003 Jun 12-15 | 15 | 48 | 24 | 9 | 4 |
| 2002 Jun 3-6 | 17 | 41 | 25 | 10 | 7 |
| 2001 Jun 11-17 | 15 | 43 | 28 | 9 | 5 |
| Black adults | |||||
| 2021 Jun 1-Jul 5 | 5 | 11 | 27 | 57 | * |
| 2020 Jun 8-Jul 24 | 5 | 16 | 22 | 55 | 2 |
| 2018 Nov 19-Dec 22 | 8 | 11 | 17 | 62 | 1 |
| 2016 Jun 7-Jul 1 | 11 | 27 | 31 | 30 | 1 |
| 2015 Jun 15-Jul 10 | 10 | 30 | 37 | 22 | 1 |
| 2013 Jun 13-Jul 5 | 7 | 33 | 33 | 24 | 3 |
| 2008 Jun 5-Jul 6 | 13 | 25 | 28 | 27 | 7 |
| 2007 Jun 4-24 | 7 | 25 | 36 | 26 | 6 |
| 2006 Jun 8-25 | 9 | 29 | 32 | 26 | 4 |
| 2005 Jun 6-25 | 8 | 33 | 31 | 20 | 8 |
| 2003 Jun 12-18 | 14 | 30 | 25 | 26 | 5 |
| 2002 Jun 3-9 | 8 | 33 | 27 | 24 | 8 |
| 2001 Jun 11-17 | 6 | 29 | 32 | 25 | 8 |
| Hispanic adults | |||||
| 2021 Jun 1-Jul 5 | 9 | 21 | 26 | 45 | -- |
| 2018 Nov 19-Dec 22 | 12 | 15 | 24 | 48 | 1 |
| 2016 Jun 7-Jul 1 | 10 | 22 | 29 | 37 | 2 |
| 2015 Jun 15-Jul 10 | 10 | 23 | 35 | 30 | 1 |
| 2013 Jun 13-Jul 5 | 10 | 25 | 31 | 32 | 2 |
| 2008 Jun 5-Jul 6 | 10 | 19 | 23 | 45 | 3 |
| 2007 Jun 4-24 | 8 | 17 | 25 | 46 | 3 |
| 2006 Jun 8-25 | 11 | 15 | 23 | 48 | 2 |
| 2005 Jun 6-25 | 10 | 19 | 29 | 39 | 3 |
| 2003 Jun 12-18 | 11 | 31 | 27 | 29 | 2 |
| 2002 Jun 3-9 | 12 | 32 | 19 | 33 | 4 |
| 2001 Jun 11-17 | 10 | 26 | 27 | 33 | 4 |
| * Less than 0.5% | |||||
| Gallup | |||||
Next, we'd like to know how you feel about the way various groups in society are treated. For each of the following groups, please say whether you are very satisfied, somewhat satisfied, somewhat dissatisfied or very dissatisfied with the way they are treated. How about … Women?
| Very satisfied | Somewhat satisfied | Somewhat dissatisfied | Very dissatisfied | No opinion | |
|---|---|---|---|---|---|
| % | % | % | % | % | |
| National adults | |||||
| 2021 Jun 1-Jul 5 | 19 | 34 | 25 | 23 | * |
| 2020 Jun 8-Jul 24 | 16 | 38 | 23 | 23 | * |
| 2018 Nov 19-Dec 22 | 24 | 29 | 23 | 22 | 1 |
| 2016 Jun 7-Jul 1 | 22 | 41 | 22 | 14 | 1 |
| 2015 Jun 15-Jul 10 | 24 | 40 | 21 | 14 | * |
| 2013 Jun 13-Jul 5 | 24 | 44 | 21 | 11 | 1 |
| 2008 Jun 5-Jul 6 | 26 | 42 | 19 | 12 | 1 |
| 2007 Jun 4-24 | 26 | 43 | 17 | 11 | 3 |
| 2006 Jun 8-25 | 25 | 42 | 20 | 11 | 1 |
| 2005 Jun 6-25 | 24 | 46 | 20 | 9 | 1 |
| 2003 Jun 12-18 | 28 | 44 | 17 | 10 | 1 |
| 2002 Jun 3-9 | 25 | 47 | 17 | 9 | 2 |
| 2001 Jun 11-17 | 24 | 46 | 18 | 11 | 1 |
| White adults | |||||
| 2021 Jun 1-Jul 5 | 20 | 37 | 23 | 20 | * |
| 2020 Jun 8-Jul 24 | 17 | 41 | 25 | 17 | * |
| 2018 Nov 19-Dec 22 | 29 | 31 | 23 | 17 | 1 |
| 2016 Jun 7-Jul 1 | 24 | 44 | 21 | 10 | 1 |
| 2015 Jun 15-Jul 10 | 26 | 42 | 19 | 12 | * |
| 2013 Jun 13-Jul 5 | 26 | 44 | 19 | 10 | * |
| 2008 Jun 5-Jul 6 | 29 | 46 | 16 | 9 | * |
| 2007 Jun 4-24 | 27 | 46 | 16 | 8 | 3 |
| 2006 Jun 8-25 | 28 | 46 | 18 | 7 | 1 |
| 2005 Jun 6-25 | 25 | 50 | 19 | 6 | * |
| 2003 Jun 12-15 | 31 | 45 | 15 | 8 | 1 |
| 2002 Jun 3-6 | 26 | 50 | 17 | 6 | 1 |
| 2001 Jun 11-17 | 24 | 49 | 17 | 9 | 1 |
| Black adults | |||||
| 2021 Jun 1-Jul 5 | 9 | 30 | 20 | 41 | * |
| 2020 Jun 8-Jul 24 | 8 | 29 | 22 | 40 | * |
| 2018 Nov 19-Dec 22 | 10 | 20 | 26 | 43 | 1 |
| 2016 Jun 7-Jul 1 | 16 | 33 | 30 | 21 | 1 |
| 2015 Jun 15-Jul 10 | 17 | 36 | 27 | 20 | 1 |
| 2013 Jun 13-Jul 5 | 15 | 41 | 25 | 16 | 2 |
| 2008 Jun 5-Jul 6 | 15 | 32 | 31 | 21 | 2 |
| 2007 Jun 4-24 | 15 | 30 | 28 | 25 | 2 |
| 2006 Jun 8-25 | 12 | 39 | 29 | 20 | 1 |
| 2005 Jun 6-25 | 17 | 36 | 28 | 17 | 2 |
| 2003 Jun 12-18 | 17 | 35 | 24 | 21 | 3 |
| 2002 Jun 3-9 | 19 | 40 | 17 | 22 | 2 |
| 2001 Jun 11-17 | 14 | 33 | 31 | 20 | 2 |
| Hispanic adults | |||||
| 2021 Jun 1-Jul 5 | 23 | 23 | 29 | 25 | -- |
| 2018 Nov 19-Dec 22 | 18 | 28 | 24 | 29 | 1 |
| 2016 Jun 7-Jul 1 | 22 | 34 | 22 | 21 | 1 |
| 2015 Jun 15-Jul 10 | 24 | 37 | 23 | 15 | 2 |
| 2013 Jun 13-Jul 5 | 22 | 44 | 22 | 11 | 1 |
| 2008 Jun 5-Jul 6 | 20 | 35 | 22 | 20 | 3 |
| 2007 Jun 4-24 | 23 | 37 | 20 | 19 | 2 |
| 2006 Jun 8-25 | 33 | 27 | 19 | 19 | 2 |
| 2005 Jun 6-25 | 23 | 36 | 20 | 17 | 4 |
| 2003 Jun 12-18 | 26 | 42 | 17 | 14 | 1 |
| 2002 Jun 3-9 | 26 | 41 | 17 | 12 | 4 |
| 2001 Jun 11-17 | 27 | 33 | 18 | 20 | 2 |
| Men | |||||
| 2021 Jun 1-Jul 5 | 25 | 36 | 21 | 18 | * |
| 2020 Jun 8-Jul 24 | 22 | 40 | 20 | 18 | 1 |
| 2018 Nov 19-Dec 22 | 30 | 31 | 21 | 17 | 1 |
| 2016 Jun 7-Jul 1 | 28 | 38 | 22 | 10 | 1 |
| 2015 Jun 15-Jul 10 | 29 | 41 | 19 | 11 | * |
| 2013 Jun 13-Jul 5 | 30 | 42 | 18 | 9 | 1 |
| 2008 Jun 5-Jul 6 | 37 | 38 | 13 | 10 | 2 |
| 2007 Jun 4-24 | 33 | 42 | 13 | 9 | 4 |
| 2006 Jun 8-25 | 35 | 39 | 19 | 7 | 1 |
| 2005 Jun 6-25 | 28 | 46 | 17 | 7 | 2 |
| 2003 Jun 12-18 | 36 | 40 | 17 | 6 | 1 |
| 2002 Jun 3-9 | 34 | 43 | 15 | 6 | 2 |
| 2001 Jun 11-17 | 35 | 45 | 13 | 6 | 1 |
| Women | |||||
| 2021 Jun 1-Jul 5 | 12 | 32 | 28 | 27 | * |
| 2020 Jun 8-Jul 24 | 10 | 36 | 26 | 28 | * |
| 2018 Nov 19-Dec 22 | 19 | 27 | 25 | 27 | 1 |
| 2016 Jun 7-Jul 1 | 17 | 44 | 22 | 17 | 1 |
| 2015 Jun 15-Jul 10 | 19 | 40 | 23 | 16 | * |
| 2013 Jun 13-Jul 5 | 18 | 45 | 23 | 14 | 1 |
| 2008 Jun 5-Jul 6 | 16 | 45 | 24 | 15 | 1 |
| 2007 Jun 4-24 | 21 | 45 | 20 | 13 | 2 |
| 2006 Jun 8-25 | 17 | 45 | 22 | 15 | 1 |
| 2005 Jun 6-25 | 19 | 47 | 23 | 10 | 1 |
| 2003 Jun 12-18 | 21 | 48 | 16 | 14 | 1 |
| 2002 Jun 3-9 | 18 | 51 | 19 | 11 | 1 |
| 2001 Jun 11-17 | 13 | 48 | 22 | 15 | 2 |
| * Less than 0.5% | |||||
| Gallup | |||||
Next, we'd like to know how you feel about the way various groups in society are treated. For each of the following groups, please say whether you are very satisfied, somewhat satisfied, somewhat dissatisfied or very dissatisfied with the way they are treated. How about … Black people?
| Very satisfied | Somewhat satisfied | Somewhat dissatisfied | Very dissatisfied | No opinion | |
|---|---|---|---|---|---|
| % | % | % | % | % | |
| National adults | |||||
| 2021 Jun 1-Jul 5 | 13 | 25 | 23 | 38 | * |
| 2020 Jun 8-Jul 24 | 11 | 24 | 19 | 46 | * |
| 2018 Nov 19-Dec 22 | 18 | 26 | 24 | 30 | 2 |
| 2016 Jun 7-Jul 1 | 16 | 35 | 27 | 20 | 1 |
| 2015 Jun 15-Jul 10 | 17 | 32 | 27 | 23 | 1 |
| 2013 Jun 13-Jul 5 | 19 | 43 | 24 | 12 | 2 |
| 2008 Jun 5-Jul 6 | 18 | 41 | 25 | 14 | 3 |
| 2007 Jun 4-24 | 21 | 42 | 20 | 13 | 4 |
| 2006 Jun 8-25 | 17 | 44 | 24 | 12 | 3 |
| 2005 Jun 6-25 | 16 | 43 | 23 | 14 | 4 |
| 2003 Jun 12-18 | 20 | 44 | 22 | 12 | 2 |
| 2002 Jun 3-9 | 19 | 45 | 22 | 11 | 3 |
| 2001 Jun 11-17 | 20 | 41 | 24 | 13 | 2 |
| White adults | |||||
| 2021 Jun 1-Jul 5 | 15 | 29 | 23 | 32 | * |
| 2020 Jun 8-Jul 24 | 12 | 29 | 20 | 39 | * |
| 2018 Nov 19-Dec 22 | 22 | 29 | 24 | 24 | 2 |
| 2016 Jun 7-Jul 1 | 17 | 39 | 28 | 15 | 1 |
| 2015 Jun 15-Jul 10 | 18 | 35 | 27 | 18 | 1 |
| 2013 Jun 13-Jul 5 | 22 | 45 | 23 | 10 | 1 |
| 2008 Jun 5-Jul 6 | 20 | 43 | 24 | 10 | 2 |
| 2007 Jun 4-24 | 22 | 49 | 15 | 9 | 4 |
| 2006 Jun 8-25 | 17 | 49 | 24 | 7 | 3 |
| 2005 Jun 6-25 | 18 | 48 | 21 | 10 | 3 |
| 2003 Jun 12-15 | 22 | 46 | 22 | 8 | 2 |
| 2002 Jun 3-6 | 19 | 49 | 21 | 8 | 3 |
| 2001 Jun 11-17 | 20 | 44 | 25 | 9 | 2 |
| Black adults | |||||
| 2021 Jun 1-Jul 5 | 6 | 9 | 20 | 65 | * |
| 2020 Jun 8-Jul 24 | 4 | 17 | 13 | 66 | * |
| 2018 Nov 19-Dec 22 | 7 | 11 | 18 | 62 | 1 |
| 2016 Jun 7-Jul 1 | 12 | 20 | 25 | 42 | * |
| 2015 Jun 15-Jul 10 | 11 | 22 | 22 | 45 | * |
| 2013 Jun 13-Jul 5 | 9 | 38 | 30 | 22 | 1 |
| 2008 Jun 5-Jul 6 | 9 | 26 | 28 | 36 | 1 |
| 2007 Jun 4-24 | 8 | 22 | 30 | 38 | 2 |
| 2006 Jun 8-25 | 7 | 30 | 29 | 33 | 1 |
| 2005 Jun 6-25 | 8 | 33 | 28 | 30 | 1 |
| 2003 Jun 12-18 | 10 | 30 | 20 | 39 | 1 |
| 2002 Jun 3-9 | 12 | 31 | 26 | 29 | 2 |
| 2001 Jun 11-17 | 8 | 31 | 28 | 32 | 1 |
| Hispanic adults | |||||
| 2021 Jun 1-Jul 5 | 12 | 25 | 22 | 40 | * |
| 2018 Nov 19-Dec 22 | 13 | 26 | 29 | 30 | 2 |
| 2016 Jun 7-Jul 1 | 20 | 27 | 25 | 28 | 1 |
| 2015 Jun 15-Jul 10 | 15 | 29 | 31 | 23 | 1 |
| 2013 Jun 13-Jul 5 | 16 | 45 | 23 | 14 | 3 |
| 2008 Jun 5-Jul 6 | 15 | 33 | 27 | 19 | 6 |
| 2007 Jun 4-24 | 17 | 29 | 31 | 16 | 6 |
| 2006 Jun 8-25 | 23 | 23 | 27 | 20 | 7 |
| 2005 Jun 6-25 | 15 | 30 | 27 | 19 | 9 |
| 2003 Jun 12-18 | 11 | 47 | 22 | 16 | 4 |
| 2002 Jun 3-9 | 19 | 38 | 24 | 14 | 5 |
| 2001 Jun 11-17 | 15 | 35 | 26 | 18 | 6 |
| * Less than 0.5% | |||||
| Gallup | |||||
Next, we'd like to know how you feel about the way various groups in society are treated. For each of the following groups, please say whether you are very satisfied, somewhat satisfied, somewhat dissatisfied or very dissatisfied with the way they are treated. How about … Hispanic people?
| Very satisfied | Somewhat satisfied | Somewhat dissatisfied | Very dissatisfied | No opinion | |
|---|---|---|---|---|---|
| % | % | % | % | % | |
| National adults | |||||
| 2021 Jun 1-Jul 5 | 14 | 32 | 28 | 26 | * |
| 2020 Jun 8-Jul 24 | 11 | 30 | 26 | 32 | 1 |
| 2018 Nov 19-Dec 22 | 18 | 28 | 25 | 26 | 2 |
| 2016 Jun 7-Jul 1 | 15 | 39 | 28 | 15 | 3 |
| 2015 Jun 15-Jul 10 | 17 | 41 | 26 | 14 | 2 |
| 2013 Jun 13-Jul 5 | 16 | 42 | 27 | 13 | 1 |
| 2008 Jun 5-Jul 6 | 14 | 42 | 26 | 15 | 3 |
| 2007 Jun 4-24 | 16 | 40 | 20 | 17 | 7 |
| 2006 Jun 8-25 | 18 | 39 | 25 | 14 | 5 |
| 2005 Jun 6-25 | 17 | 41 | 27 | 10 | 5 |
| 2003 Jun 12-18 | 18 | 47 | 22 | 10 | 3 |
| 2002 Jun 3-9 | 17 | 47 | 22 | 9 | 5 |
| 2001 Jun 11-17 | 16 | 44 | 23 | 12 | 5 |
| White adults | |||||
| 2021 Jun 1-Jul 5 | 14 | 38 | 25 | 23 | * |
| 2020 Jun 8-Jul 24 | 11 | 35 | 27 | 26 | 1 |
| 2018 Nov 19-Dec 22 | 21 | 32 | 25 | 19 | 2 |
| 2016 Jun 7-Jul 1 | 16 | 43 | 27 | 11 | 3 |
| 2015 Jun 15-Jul 10 | 18 | 43 | 26 | 11 | 2 |
| 2013 Jun 13-Jul 5 | 17 | 45 | 26 | 11 | 1 |
| 2008 Jun 5-Jul 6 | 15 | 45 | 26 | 11 | 3 |
| 2007 Jun 4-24 | 17 | 46 | 15 | 14 | 8 |
| 2006 Jun 8-25 | 19 | 43 | 23 | 10 | 5 |
| 2005 Jun 6-25 | 18 | 42 | 28 | 7 | 5 |
| 2003 Jun 12-15 | 19 | 50 | 21 | 6 | 4 |
| 2002 Jun 3-6 | 17 | 51 | 21 | 6 | 5 |
| 2001 Jun 11-17 | 17 | 47 | 23 | 9 | 4 |
| Black adults | |||||
| 2021 Jun 1-Jul 5 | 6 | 19 | 36 | 39 | * |
| 2020 Jun 8-Jul 24 | 6 | 20 | 31 | 43 | * |
| 2018 Nov 19-Dec 22 | 8 | 17 | 27 | 47 | 1 |
| 2016 Jun 7-Jul 1 | 15 | 28 | 33 | 23 | 1 |
| 2015 Jun 15-Jul 10 | 12 | 39 | 30 | 18 | 1 |
| 2013 Jun 13-Jul 5 | 10 | 38 | 33 | 17 | 2 |
| 2008 Jun 5-Jul 6 | 10 | 30 | 33 | 20 | 7 |
| 2007 Jun 4-24 | 9 | 30 | 36 | 20 | 6 |
| 2006 Jun 8-25 | 11 | 34 | 33 | 17 | 5 |
| 2005 Jun 6-25 | 14 | 36 | 31 | 12 | 7 |
| 2003 Jun 12-18 | 15 | 38 | 23 | 21 | 3 |
| 2002 Jun 3-9 | 14 | 35 | 27 | 15 | 9 |
| 2001 Jun 11-17 | 7 | 34 | 31 | 20 | 8 |
| Hispanic adults | |||||
| 2021 Jun 1-Jul 5 | 18 | 22 | 31 | 29 | * |
| 2018 Nov 19-Dec 22 | 14 | 23 | 27 | 35 | 1 |
| 2016 Jun 7-Jul 1 | 15 | 31 | 22 | 31 | 1 |
| 2015 Jun 15-Jul 10 | 16 | 35 | 22 | 25 | 1 |
| 2013 Jun 13-Jul 5 | 16 | 35 | 31 | 18 | 1 |
| 2008 Jun 5-Jul 6 | 11 | 32 | 25 | 30 | 2 |
| 2007 Jun 4-24 | 12 | 25 | 29 | 32 | 3 |
| 2006 Jun 8-25 | 18 | 22 | 28 | 31 | 1 |
| 2005 Jun 6-25 | 15 | 30 | 27 | 27 | 1 |
| 2003 Jun 12-18 | 11 | 40 | 24 | 23 | 2 |
| 2002 Jun 3-9 | 16 | 37 | 24 | 21 | 2 |
| 2001 Jun 11-17 | 15 | 30 | 25 | 29 | 1 |
| * Less than 0.5% | |||||
| Gallup | |||||
Next, we'd like to know how you feel about the way various groups in society are treated. For each of the following groups, please say whether you are very satisfied, somewhat satisfied, somewhat dissatisfied or very dissatisfied with the way they are treated. How about … Asian people?
| Very satisfied | Somewhat satisfied | Somewhat dissatisfied | Very dissatisfied | No opinion | |
|---|---|---|---|---|---|
| % | % | % | % | % | |
| National adults | |||||
| 2021 Jun 1-Jul 5 | 14 | 32 | 27 | 27 | 1 |
| 2020 Jun 8-Jul 24 | 17 | 43 | 22 | 16 | 1 |
| 2018 Nov 19-Dec 22 | 26 | 40 | 19 | 10 | 5 |
| 2016 Jun 7-Jul 1 | 28 | 47 | 16 | 5 | 5 |
| 2015 Jun 15-Jul 10 | 28 | 49 | 14 | 4 | 4 |
| 2013 Jun 13-Jul 5 | 29 | 49 | 13 | 4 | 5 |
| 2008 Jun 5-Jul 6 | 26 | 46 | 14 | 4 | 9 |
| 2007 Jun 4-24 | 26 | 46 | 11 | 6 | 10 |
| 2006 Jun 8-25 | 27 | 49 | 12 | 5 | 7 |
| 2005 Jun 6-25 | 27 | 45 | 14 | 5 | 9 |
| 2003 Jun 12-18 | 25 | 48 | 16 | 5 | 6 |
| 2002 Jun 3-9 | 22 | 49 | 15 | 5 | 9 |
| 2001 Jun 11-17 | 21 | 48 | 18 | 5 | 8 |
| White adults | |||||
| 2021 Jun 1-Jul 5 | 15 | 35 | 25 | 24 | 1 |
| 2020 Jun 8-Jul 24 | 19 | 46 | 22 | 12 | 1 |
| 2018 Nov 19-Dec 22 | 30 | 42 | 17 | 7 | 4 |
| 2016 Jun 7-Jul 1 | 31 | 50 | 13 | 3 | 3 |
| 2015 Jun 15-Jul 10 | 30 | 50 | 13 | 3 | 4 |
| 2013 Jun 13-Jul 5 | 32 | 50 | 11 | 3 | 3 |
| 2008 Jun 5-Jul 6 | 29 | 48 | 13 | 2 | 8 |
| 2007 Jun 4-24 | 29 | 48 | 9 | 4 | 9 |
| 2006 Jun 8-25 | 29 | 53 | 9 | 4 | 6 |
| 2005 Jun 6-25 | 30 | 47 | 12 | 4 | 7 |
| 2003 Jun 12-15 | 26 | 49 | 15 | 4 | 6 |
| 2002 Jun 3-6 | 23 | 51 | 15 | 3 | 8 |
| 2001 Jun 11-17 | 21 | 50 | 18 | 4 | 7 |
| Black adults | |||||
| 2021 Jun 1-Jul 5 | 6 | 24 | 37 | 33 | * |
| 2020 Jun 8-Jul 24 | 11 | 38 | 26 | 22 | 3 |
| 2018 Nov 19-Dec 22 | 16 | 37 | 23 | 18 | 5 |
| 2016 Jun 7-Jul 1 | 23 | 39 | 23 | 9 | 6 |
| 2015 Jun 15-Jul 10 | 24 | 51 | 16 | 6 | 3 |
| 2013 Jun 13-Jul 5 | 20 | 49 | 18 | 5 | 7 |
| 2008 Jun 5-Jul 6 | 18 | 40 | 21 | 9 | 13 |
| 2007 Jun 4-24 | 16 | 43 | 20 | 10 | 11 |
| 2006 Jun 8-25 | 19 | 44 | 21 | 8 | 8 |
| 2005 Jun 6-25 | 17 | 41 | 21 | 8 | 13 |
| 2003 Jun 12-18 | 20 | 40 | 24 | 9 | 7 |
| 2002 Jun 3-9 | 16 | 44 | 20 | 10 | 10 |
| 2001 Jun 11-17 | 13 | 40 | 26 | 12 | 9 |
| Hispanic adults | |||||
| 2021 Jun 1-Jul 5 | 13 | 31 | 24 | 30 | 2 |
| 2018 Nov 19-Dec 22 | 20 | 36 | 24 | 13 | 7 |
| 2016 Jun 7-Jul 1 | 22 | 38 | 19 | 10 | 11 |
| 2015 Jun 15-Jul 10 | 26 | 43 | 17 | 6 | 8 |
| 2013 Jun 13-Jul 5 | 24 | 45 | 17 | 6 | 8 |
| 2008 Jun 5-Jul 6 | 18 | 41 | 15 | 8 | 18 |
| 2007 Jun 4-24 | 17 | 41 | 16 | 9 | 16 |
| 2006 Jun 8-25 | 30 | 28 | 18 | 11 | 14 |
| 2005 Jun 6-25 | 23 | 35 | 19 | 10 | 13 |
| 2003 Jun 12-18 | 20 | 51 | 15 | 8 | 6 |
| 2002 Jun 3-9 | 19 | 42 | 13 | 11 | 15 |
| 2001 Jun 11-17 | 18 | 33 | 22 | 13 | 14 |
| * Less than 0.5% | |||||
| Gallup | |||||
Next, we'd like to know how you feel about the way various groups in society are treated. For each of the following groups, please say whether you are very satisfied, somewhat satisfied, somewhat dissatisfied or very dissatisfied with the way they are treated. How about … Arab people?
| Very satisfied | Somewhat satisfied | Somewhat dissatisfied | Very dissatisfied | No opinion | |
|---|---|---|---|---|---|
| % | % | % | % | % | |
| National adults | |||||
| 2021 Jun 1-Jul 5 | 12 | 31 | 29 | 27 | 1 |
| 2020 Jun 8-Jul 24 | 11 | 33 | 24 | 31 | 2 |
| 2018 Nov 19-Dec 22 | 16 | 28 | 23 | 27 | 6 |
| 2016 Jun 7-Jul 1 | 14 | 31 | 30 | 21 | 5 |
| 2015 Jun 15-Jul 10 | 13 | 36 | 29 | 17 | 4 |
| 2013 Jun 13-Jul 5 | 15 | 36 | 25 | 17 | 7 |
| 2008 Jun 5-Jul 6 | 14 | 33 | 23 | 16 | 14 |
| 2007 Jun 4-24 | 17 | 35 | 21 | 13 | 14 |
| 2006 Jun 8-25 | 15 | 30 | 28 | 16 | 11 |
| White adults | |||||
| 2021 Jun 1-Jul 5 | 13 | 33 | 28 | 24 | 2 |
| 2020 Jun 8-Jul 24 | 12 | 35 | 24 | 28 | 1 |
| 2018 Nov 19-Dec 22 | 18 | 30 | 23 | 23 | 6 |
| 2016 Jun 7-Jul 1 | 15 | 32 | 31 | 18 | 5 |
| 2015 Jun 15-Jul 10 | 13 | 37 | 30 | 16 | 4 |
| 2013 Jun 13-Jul 5 | 16 | 37 | 25 | 17 | 6 |
| 2008 Jun 5-Jul 6 | 14 | 37 | 21 | 15 | 14 |
| 2007 Jun 4-24 | 18 | 39 | 20 | 11 | 13 |
| 2006 Jun 8-25 | 14 | 33 | 31 | 15 | 7 |
| Black adults | |||||
| 2021 Jun 1-Jul 5 | 4 | 26 | 34 | 34 | 2 |
| 2020 Jun 8-Jul 24 | 7 | 27 | 28 | 35 | 2 |
| 2018 Nov 19-Dec 22 | 8 | 19 | 28 | 41 | 4 |
| 2016 Jun 7-Jul 1 | 10 | 25 | 31 | 29 | 5 |
| 2015 Jun 15-Jul 10 | 13 | 36 | 27 | 21 | 6 |
| 2013 Jun 13-Jul 5 | 11 | 31 | 30 | 22 | 7 |
| 2008 Jun 5-Jul 6 | 12 | 26 | 30 | 18 | 14 |
| 2007 Jun 4-24 | 8 | 28 | 26 | 23 | 15 |
| 2006 Jun 8-25 | 9 | 32 | 27 | 16 | 15 |
| Hispanic adults | |||||
| 2021 Jun 1-Jul 5 | 12 | 29 | 28 | 29 | 1 |
| 2018 Nov 19-Dec 22 | 12 | 27 | 24 | 31 | 5 |
| 2016 Jun 7-Jul 1 | 13 | 31 | 25 | 24 | 8 |
| 2015 Jun 15-Jul 10 | 15 | 33 | 26 | 21 | 6 |
| 2013 Jun 13-Jul 5 | 14 | 36 | 25 | 15 | 10 |
| 2008 Jun 5-Jul 6 | 13 | 26 | 22 | 18 | 21 |
| 2007 Jun 4-24 | 12 | 26 | 28 | 15 | 19 |
| 2006 Jun 8-25 | 17 | 20 | 22 | 20 | 22 |
| * Less than 0.5% | |||||
| Gallup | |||||
Next, we'd like to know how you feel about the way various groups in society are treated. For each of the following groups, please say whether you are very satisfied, somewhat satisfied, somewhat dissatisfied or very dissatisfied with the way they are treated. How about … Jewish people?
| Very satisfied | Somewhat satisfied | Somewhat dissatisfied | Very dissatisfied | No opinion | |
|---|---|---|---|---|---|
| % | % | % | % | % | |
| National adults | |||||
| 2021 Jun 1-Jul 5 | 16 | 35 | 26 | 23 | 1 |
| White adults | |||||
| 2021 Jun 1-Jul 5 | 17 | 36 | 24 | 23 | 1 |
| Black adults | |||||
| 2021 Jun 1-Jul 5 | 10 | 35 | 27 | 26 | 2 |
| Hispanic adults | |||||
| 2021 Jun 1-Jul 5 | 13 | 32 | 33 | 22 | * |
| * Less than 0.5% | |||||
| Gallup | |||||
Next, we'd like to know how you feel about the way various groups in society are treated. For each of the following groups, please say whether you are very satisfied, somewhat satisfied, somewhat dissatisfied or very dissatisfied with the way they are treated. How about … White people?
| Very satisfied | Somewhat satisfied | Somewhat dissatisfied | Very dissatisfied | No opinion | |
|---|---|---|---|---|---|
| % | % | % | % | % | |
| National adults | |||||
| 2021 Jun 1-Jul 5 | 31 | 37 | 19 | 14 | * |
| White adults | |||||
| 2021 Jun 1-Jul 5 | 28 | 41 | 17 | 13 | 1 |
| Black adults | |||||
| 2021 Jun 1-Jul 5 | 28 | 34 | 17 | 20 | 1 |
| Hispanic adults | |||||
| 2021 Jun 1-Jul 5 | 38 | 26 | 23 | 14 | * |
| * Less than 0.5% | |||||
| Gallup | |||||
In general, do you think that Black people have as good a chance as White people in your community to get any kind of job for which they are qualified, or don't you think they have as good a chance?
| Yes, have as good a chance | No, do not | No opinion | |
|---|---|---|---|
| % | % | % | |
| National adults | |||
| 2021 Jun 1-Jul 5 | 55 | 44 | * |
| 2020 Jun 8-Jul 24 | 58 | 42 | * |
| 2018 Nov 19-Dec 22 | 61 | 37 | 1 |
| 2016 Jun 7-Jul 1 | 64 | 36 | * |
| 2015 Jun 15-Jul 10 | 66 | 33 | 1 |
| 2013 Jun 13-Jul 5 | 68 | 31 | 1 |
| 2011 Aug 4-7 | 72 | 26 | 1 |
| 2009 Oct 16-19 | 79 | 19 | 2 |
| 2008 Jun 5-Jul 6 | 71 | 27 | 2 |
| 2007 Jun 4-24 | 71 | 27 | 2 |
| 2005 Jun 6-25 | 71 | 28 | 1 |
| 2004 Jun 9-30 | 72 | 26 | 2 |
| 1999 Sep 24-Nov 16 | 74 | 24 | 2 |
| 1998 Aug 13-Oct 26 | 77 | 21 | 2 |
| 1997 Jan 4-Feb 28 | 75 | 23 | 2 |
| 1995 Oct 19-22 | 71 | 25 | 4 |
| 1995 Mar 17-19 | 64 | 32 | 4 |
| 1993 Aug 23-25 | 65 | 31 | 4 |
| 1991 Jun 13-16 | 68 | 26 | 6 |
| 1990 Jun 7-10 | 69 | 23 | 8 |
| 1989 Dec 7-10 | 65 | 28 | 7 |
| 1978 Jul 7-10 | 67 | 24 | 9 |
| 1963 Jun 21-26 | 39 | 48 | 13 |
| 1963 Mar | 43 | n/a | n/a |
| White adults | |||
| 2021 Jun 1-Jul 5 | 60 | 39 | 1 |
| 2020 Jun 8-Jul 24 | 61 | 39 | * |
| 2018 Nov 19-Dec 22 | 67 | 32 | 1 |
| 2016 Jun 7-Jul 1 | 70 | 30 | * |
| 2015 Jun 15-Jul 10 | 72 | 27 | 1 |
| 2013 Jun 13-Jul 5 | 74 | 25 | 1 |
| 2011 Aug 4-7 | 78 | 21 | 1 |
| 2009 Oct 16-19 | 82 | 16 | 2 |
| 2008 Jun 5-Jul 6 | 77 | 21 | 2 |
| 2007 Jun 4-24 | 76 | 22 | 3 |
| 2005 Jun 6-25 | 78 | 21 | 1 |
| 2004 Jun 9-30 | 77 | 21 | 2 |
| 1999 Sep 24-Nov 16 | 79 | 19 | 2 |
| 1998 Aug 13-Oct 26 | 82 | 17 | 1 |
| 1997 Jan 4-Feb 28 | 79 | 18 | 3 |
| 1995 Oct 19-22 | 75 | 21 | 4 |
| 1995 Mar 17-19 | 68 | 27 | 5 |
| 1993 Aug 23-25 | 70 | 27 | 3 |
| 1991 Jun 13-16 | 70 | 23 | 7 |
| 1990 Jun 7-10 | 73 | 20 | 7 |
| 1989 Dec 7-10 | 68 | 25 | 7 |
| 1978 Jul 7-10 | 73 | 19 | 9 |
| 1963 Jun 21-26 | 41 | 44 | 14 |
| 1963 Mar | 46 | n/a | n/a |
| Black adults | |||
| 2021 Jun 1-Jul 5 | 31 | 69 | * |
| 2020 Jun 8-Jul 24 | 31 | 69 | -- |
| 2018 Nov 19-Dec 22 | 30 | 69 | 1 |
| 2016 Jun 7-Jul 1 | 32 | 68 | * |
| 2015 Jun 15-Jul 10 | 36 | 63 | 1 |
| 2013 Aug 9-22 | 39 | 60 | 1 |
| 2013 Jun 13-Jul 5 | 40 | 59 | 1 |
| 2011 Aug 4-7 | 39 | 59 | 3 |
| 2009 Oct 16-19 | 49 | 49 | 2 |
| 2008 Jun 5-Jul 6 | 43 | 56 | 1 |
| 2007 Jun 4-24 | 37 | 61 | 2 |
| 2005 Jun 6-25 | 33 | 65 | 2 |
| 2004 Jun 9-30 | 41 | 57 | 2 |
| 1999 Sep 24-Nov 16 | 40 | 57 | 3 |
| 1998 Aug 13-Oct 26 | 45 | 52 | 3 |
| 1997 Jan 4-Feb 28 | 46 | 51 | 3 |
| 1995 Oct 19-22 | 52 | 45 | 3 |
| 1995 Mar 17-19 | 36 | 62 | 2 |
| 1993 Aug 23-25 | 30 | 66 | 4 |
| 1991 Jun 13-16 | 40 | 58 | 2 |
| 1990 Jun 7-10 | 43 | 54 | 3 |
| 1989 Dec 7-10 | 43 | 54 | 3 |
| 1978 Jul 7-10 | 35 | 57 | 8 |
| 1963 Jun 21-26 | 23 | 74 | 3 |
| 1963 Mar | 24 | n/a | n/a |
| Hispanic adults | |||
| 2021 Jun 1-Jul 5 | 56 | 44 | * |
| 2018 Nov 19-Dec 22 | 64 | 36 | 1 |
| 2016 Jun 7-Jul 1 | 65 | 35 | 1 |
| 2015 Jun 15-Jul 10 | 69 | 30 | 1 |
| 2013 Jun 13-Jul 5 | 69 | 29 | 1 |
| 2008 Jun 5-Jul 6 | 68 | 32 | 1 |
| 2007 Jun 4-24 | 69 | 30 | 1 |
| 2005 Jun 6-25 | 66 | 31 | 3 |
| 2004 Jun 9-30 | 69 | 29 | 2 |
| Trends for White adults and Black adults from 2004 to present exclude Hispanic adults; trends for White adults and Black adults from 1963 to 1999 include White and Black Hispanic adults. | |||
| Gallup | |||
Again, in general, do you think that Black people have as good a chance as White people in your community to get any housing they can afford, or don't you think they have as good a chance?
| Yes, have as good a chance | No, do not | No opinion | |
|---|---|---|---|
| % | % | % | |
| National adults | |||
| 2021 Jun 1-Jul 5 | 60 | 39 | 1 |
| 2020 Jun 8-Jul 24 | 63 | 37 | 1 |
| 2018 Nov 19-Dec 22 | 67 | 31 | 1 |
| 2016 Jun 7-Jul 1 | 70 | 29 | 1 |
| 2015 Jun 15-Jul 10 | 77 | 23 | * |
| 2013 Jun 13-Jul 5 | 79 | 20 | 1 |
| 2008 Jun 5-Jul 6 | 78 | 20 | 2 |
| 2007 Jun 4-24 | 77 | 20 | 2 |
| 2005 Jun 6-25 | 77 | 21 | 2 |
| 2004 Jun 9-30 | 81 | 18 | 1 |
| 2002 Dec 9-2003 Feb 11 | 77 | 20 | 3 |
| 2001 Mar 23-May 16 | 79 | 18 | 3 |
| 1999 Sep 24-Nov 16 | 79 | 18 | 3 |
| 1998 Aug 13-Oct 26 | 82 | 16 | 2 |
| 1997 Jan 4-Feb 28 | 83 | 13 | 4 |
| 1991 Jun 13-16 | 72 | 23 | 5 |
| 1990 Jun 7-10 | 72 | 19 | 9 |
| 1989 Dec 7-10 | 68 | 26 | 6 |
| White adults | |||
| 2021 Jun 1-Jul 5 | 65 | 34 | 1 |
| 2020 Jun 8-Jul 24 | 66 | 34 | 1 |
| 2018 Nov 19-Dec 22 | 73 | 25 | 1 |
| 2016 Jun 7-Jul 1 | 75 | 24 | 1 |
| 2015 Jun 15-Jul 10 | 84 | 16 | * |
| 2013 Jun 13-Jul 5 | 85 | 15 | 1 |
| 2008 Jun 5-Jul 6 | 85 | 13 | 2 |
| 2007 Jun 4-24 | 84 | 13 | 3 |
| 2005 Jun 6-25 | 82 | 16 | 2 |
| 2004 Jun 9-30 | 86 | 13 | 1 |
| 2002 Dec 9-2003 Feb 11 | 82 | 16 | 2 |
| 2001 Mar 23-May 16 | 83 | 14 | 3 |
| 1999 Sep 24-Nov 16 | 83 | 15 | 2 |
| 1998 Aug 13-Oct 26 | 86 | 12 | 2 |
| 1997 Jan 4-Feb 28 | 86 | 10 | 4 |
| 1991 Jun 13-16 | 74 | 21 | 5 |
| 1990 Jun 7-10 | 75 | 16 | 9 |
| 1989 Dec 7-10 | 71 | 23 | 6 |
| Black adults | |||
| 2021 Jun 1-Jul 5 | 36 | 64 | -- |
| 2020 Jun 8-Jul 24 | 38 | 62 | * |
| 2018 Nov 19-Dec 22 | 40 | 59 | 1 |
| 2016 Jun 7-Jul 1 | 46 | 54 | 1 |
| 2015 Jun 15-Jul 10 | 48 | 52 | * |
| 2013 Aug 9-22 | 51 | 48 | 1 |
| 2013 Jun 13-Jul 5 | 56 | 43 | 1 |
| 2008 Jun 5-Jul 6 | 52 | 47 | 2 |
| 2007 Jun 4-24 | 44 | 54 | 2 |
| 2005 Jun 6-25 | 51 | 48 | 1 |
| 2004 Jun 9-30 | 55 | 44 | 1 |
| 2002 Dec 9-2003 Feb 11 | 48 | 49 | 3 |
| 2001 Mar 23-May 16 | 48 | 50 | 2 |
| 1999 Sep 24-Nov 16 | 53 | 45 | 2 |
| 1998 Aug 13-Oct 26 | 54 | 43 | 3 |
| 1997 Jan 4-Feb 28 | 58 | 40 | 2 |
| 1991 Jun 13-16 | 55 | 42 | 3 |
| 1990 Jun 7-10 | 47 | 46 | 7 |
| 1989 Dec 7-10 | 51 | 45 | 5 |
| Hispanic adults | |||
| 2021 Jun 1-Jul 5 | 63 | 36 | * |
| 2018 Nov 19-Dec 22 | 67 | 32 | 1 |
| 2016 Jun 7-Jul 1 | 71 | 28 | 1 |
| 2015 Jun 15-Jul 10 | 72 | 27 | 1 |
| 2013 Jun 13-Jul 5 | 77 | 21 | 1 |
| 2008 Jun 5-Jul 6 | 69 | 28 | 3 |
| 2007 Jun 4-24 | 72 | 27 | 1 |
| 2005 Jun 6-25 | 70 | 26 | 4 |
| 2004 Jun 9-30 | 74 | 24 | 2 |
| Trends for White adults and Black adults from 2004 to present exclude Hispanic adults; trends for White adults and Black adults from 1989 to 2002 include White and Black Hispanic adults. | |||
| Gallup | |||
Just your impression, are Black people in your community treated less fairly than White people in the following situations? How about -- on the job or at work?
| Yes, treated less fairly | No, not treated less fairly | No opinion | |
|---|---|---|---|
| % | % | % | |
| National adults | |||
| 2021 Jun 1-Jul 5 | 34 | 65 | |
| 2020 Jun 8-Jul 24 | 33 | 66 | * |
| 2018 Nov 19-Dec 22 | 30 | 67 | 3 |
| 2016 Jun 7-Jul 1 | 24 | 72 | 4 |
| 2015 Jun 15-Jul 10 | 26 | 72 | 2 |
| 2007 Jun 4-24 | 18 | 78 | 4 |
| 2004 Jun 9-30 | 18 | 78 | 4 |
| 2002 Dec 9-2003 Feb 11 | 19 | 73 | 8 |
| 2001 Mar 23-May 16 | 16 | 75 | 9 |
| 1999 Sep 24-Nov 16 | 15 | 79 | 6 |
| 1998 Aug 13-Oct 26 | 13 | 79 | 8 |
| 1997 Jan 4-Feb 28 | 18 | 70 | 12 |
| White adults | |||
| 2021 Jun 1-Jul 5 | 26 | 72 | 2 |
| 2020 Jun 8-Jul 24 | 27 | 73 | * |
| 2018 Nov 19-Dec 22 | 22 | 74 | 3 |
| 2016 Jun 7-Jul 1 | 17 | 79 | 4 |
| 2015 Jun 15-Jul 10 | 20 | 78 | 2 |
| 2007 Jun 4-24 | 12 | 84 | 4 |
| 2004 Jun 9-30 | 11 | 85 | 4 |
| 2002 Dec 9-2003 Feb 11 | 14 | 78 | 8 |
| 2001 Mar 23-May 16 | 10 | 80 | 10 |
| 1999 Sep 24-Nov 16 | 10 | 84 | 6 |
| 1998 Aug 13-Oct 26 | 9 | 83 | 8 |
| 1997 Jan 4-Feb 28 | 14 | 74 | 12 |
| Black adults | |||
| 2021 Jun 1-Jul 5 | 63 | 37 | * |
| 2020 Jun 8-Jul 24 | 64 | 35 | * |
| 2018 Nov 19-Dec 22 | 60 | 38 | 3 |
| 2016 Jun 7-Jul 1 | 52 | 46 | 2 |
| 2015 Jun 15-Jul 10 | 56 | 43 | 2 |
| 2007 Jun 4-24 | 53 | 42 | 5 |
| 2004 Jun 9-30 | 49 | 44 | 7 |
| 2002 Dec 9-2003 Feb 11 | 51 | 38 | 11 |
| 2001 Mar 23-May 16 | 44 | 49 | 7 |
| 1999 Sep 24-Nov 16 | 47 | 47 | 6 |
| 1998 Aug 13-Oct 26 | 42 | 50 | 8 |
| 1997 Jan 4-Feb 28 | 45 | 46 | 9 |
| Hispanic adults | |||
| 2021 Jun 1-Jul 5 | 41 | 59 | -- |
| 2018 Nov 19-Dec 22 | 38 | 59 | 3 |
| 2016 Jun 7-Jul 1 | 30 | 65 | 5 |
| 2015 Jun 15-Jul 10 | 29 | 68 | 3 |
| 2007 Jun 4-24 | 28 | 65 | 7 |
| 2004 Jun 9-30 | 28 | 66 | 6 |
| Gallup | |||
Just your impression, are Black people in your community treated less fairly than White people in the following situations? How about -- in neighborhood shops?
| Yes, treated less fairly | No, not treated less fairly | No opinion | |
|---|---|---|---|
| % | % | % | |
| National adults | |||
| 2021 Jun 1-Jul 5 | 31 | 68 | 1 |
| 2020 Jun 8-Jul 24 | 31 | 68 | 1 |
| 2018 Nov 19-Dec 22 | 28 | 70 | 2 |
| 2016 Jun 7-Jul 1 | 21 | 76 | 3 |
| 2015 Jun 15-Jul 10 | 25 | 73 | 2 |
| 2007 Jun 4-24 | 15 | 82 | 3 |
| 2004 Jun 9-30 | 17 | 80 | 3 |
| 2002 Dec 9-2003 Feb 11 | 18 | 78 | 4 |
| 2001 Mar 23-May 16 | 16 | 79 | 5 |
| 1999 Sep 24-Nov 16 | 16 | 81 | 3 |
| 1998 Aug 13-Oct 26 | 14 | 83 | 3 |
| 1997 Jan 4-Feb 28 | 21 | 74 | 5 |
| White adults | |||
| 2021 Jun 1-Jul 5 | 26 | 73 | 1 |
| 2020 Jun 8-Jul 24 | 24 | 75 | 1 |
| 2018 Nov 19-Dec 22 | 22 | 76 | 2 |
| 2016 Jun 7-Jul 1 | 16 | 80 | 3 |
| 2015 Jun 15-Jul 10 | 20 | 79 | 2 |
| 2007 Jun 4-24 | 9 | 87 | 3 |
| 2004 Jun 9-30 | 13 | 84 | 3 |
| 2002 Dec 9-2003 Feb 11 | 12 | 84 | 4 |
| 2001 Mar 23-May 16 | 12 | 83 | 5 |
| 1999 Sep 24-Nov 16 | 13 | 84 | 3 |
| 1998 Aug 13-Oct 26 | 11 | 86 | 3 |
| 1997 Jan 4-Feb 28 | 18 | 76 | 6 |
| Black adults | |||
| 2021 Jun 1-Jul 5 | 56 | 42 | 2 |
| 2020 Jun 8-Jul 24 | 50 | 49 | 1 |
| 2018 Nov 19-Dec 22 | 48 | 51 | 1 |
| 2016 Jun 7-Jul 1 | 41 | 57 | 2 |
| 2015 Jun 15-Jul 10 | 46 | 53 | 1 |
| 2007 Jun 4-24 | 42 | 55 | 4 |
| 2004 Jun 9-30 | 36 | 61 | 3 |
| 2002 Dec 9-2003 Feb 11 | 39 | 56 | 5 |
| 2001 Mar 23-May 16 | 38 | 59 | 3 |
| 1999 Sep 24-Nov 16 | 35 | 60 | 5 |
| 1998 Aug 13-Oct 26 | 31 | 64 | 5 |
| 1997 Jan 4-Feb 28 | 42 | 53 | 5 |
| Hispanic adults | |||
| 2021 Jun 1-Jul 5 | 33 | 67 | * |
| 2018 Nov 19-Dec 22 | 40 | 58 | 2 |
| 2016 Jun 7-Jul 1 | 25 | 70 | 5 |
| 2015 Jun 15-Jul 10 | 31 | 67 | 2 |
| 2007 Jun 4-24 | 27 | 69 | 3 |
| 2004 Jun 9-30 | 27 | 71 | 2 |
| Gallup | |||
Just your impression, are Black people in your community treated less fairly than White people in the following situations? How about -- in stores downtown or in the shopping mall?
| Yes, treated less fairly | No, not treated less fairly | No opinion | |
|---|---|---|---|
| % | % | % | |
| National adults | |||
| 2021 Jun 1-Jul 5 | 33 | 66 | 1 |
| 2020 Jun 8-Jul 24 | 37 | 63 | 1 |
| 2018 Nov 19-Dec 22 | 32 | 65 | 2 |
| 2016 Jun 7-Jul 1 | 24 | 74 | 2 |
| 2015 Jun 15-Jul 10 | 29 | 69 | 2 |
| 2007 Jun 4-24 | 19 | 78 | 4 |
| 2004 Jun 9-30 | 20 | 77 | 3 |
| 2002 Dec 9-2003 Feb 11 | 22 | 72 | 6 |
| 2001 Mar 23-May 16 | 21 | 74 | 5 |
| 1999 Sep 24-Nov 16 | 19 | 77 | 4 |
| 1998 Aug 13-Oct 26 | 19 | 77 | 4 |
| 1997 Jan 4-Feb 28 | 22 | 72 | 6 |
| White adults | |||
| 2021 Jun 1-Jul 5 | 26 | 73 | 1 |
| 2020 Jun 8-Jul 24 | 30 | 69 | 1 |
| 2018 Nov 19-Dec 22 | 25 | 72 | 3 |
| 2016 Jun 7-Jul 1 | 17 | 80 | 2 |
| 2015 Jun 15-Jul 10 | 25 | 73 | 2 |
| 2007 Jun 4-24 | 13 | 83 | 3 |
| 2004 Jun 9-30 | 15 | 82 | 3 |
| 2002 Dec 9-2003 Feb 11 | 17 | 77 | 6 |
| 2001 Mar 23-May 16 | 16 | 79 | 5 |
| 1999 Sep 24-Nov 16 | 15 | 81 | 4 |
| 1998 Aug 13-Oct 26 | 16 | 81 | 3 |
| 1997 Jan 4-Feb 28 | 19 | 76 | 5 |
| Black adults | |||
| 2021 Jun 1-Jul 5 | 60 | 39 | * |
| 2020 Jun 8-Jul 24 | 55 | 45 | 1 |
| 2018 Nov 19-Dec 22 | 59 | 40 | 1 |
| 2016 Jun 7-Jul 1 | 52 | 47 | 1 |
| 2015 Jun 15-Jul 10 | 52 | 46 | 2 |
| 2007 Jun 4-24 | 47 | 48 | 6 |
| 2004 Jun 9-30 | 42 | 55 | 3 |
| 2002 Dec 9-2003 Feb 11 | 50 | 44 | 6 |
| 2001 Mar 23-May 16 | 46 | 50 | 4 |
| 1999 Sep 24-Nov 16 | 46 | 49 | 5 |
| 1998 Aug 13-Oct 26 | 41 | 54 | 5 |
| 1997 Jan 4-Feb 28 | 46 | 49 | 5 |
| Hispanic adults | |||
| 2021 Jun 1-Jul 5 | 37 | 63 | -- |
| 2018 Nov 19-Dec 22 | 43 | 56 | 2 |
| 2016 Jun 7-Jul 1 | 28 | 69 | 3 |
| 2015 Jun 15-Jul 10 | 25 | 72 | 3 |
| 2007 Jun 4-24 | 30 | 67 | 3 |
| 2004 Jun 9-30 | 30 | 67 | 3 |
| Gallup | |||
Just your impression, are Black people in your community treated less fairly than White people in the following situations? How about -- in restaurants, bars, theaters or other entertainment places?
| Yes, treated less fairly | No, not treated less fairly | No opinion | |
|---|---|---|---|
| % | % | % | |
| National adults | |||
| 2021 Jun 1-Jul 5 | 28 | 71 | 1 |
| 2020 Jun 8-Jul 24 | 31 | 68 | 1 |
| 2018 Nov 19-Dec 22 | 28 | 70 | 2 |
| 2016 Jun 7-Jul 1 | 20 | 78 | 2 |
| 2015 Jun 15-Jul 10 | 23 | 76 | 2 |
| 2007 Jun 4-24 | 16 | 81 | 2 |
| 2004 Jun 9-30 | 15 | 82 | 3 |
| 2002 Dec 9-2003 Feb 11 | 15 | 79 | 6 |
| 2001 Mar 23-May 16 | 16 | 79 | 5 |
| 1999 Sep 24-Nov 16 | 14 | 81 | 5 |
| 1998 Aug 13-Oct 26 | 13 | 83 | 4 |
| 1997 Jan 4-Feb 28 | 20 | 75 | 5 |
| White adults | |||
| 2021 Jun 1-Jul 5 | 24 | 75 | 1 |
| 2020 Jun 8-Jul 24 | 25 | 74 | 1 |
| 2018 Nov 19-Dec 22 | 22 | 76 | 2 |
| 2016 Jun 7-Jul 1 | 15 | 83 | 2 |
| 2015 Jun 15-Jul 10 | 18 | 81 | 2 |
| 2007 Jun 4-24 | 11 | 87 | 2 |
| 2004 Jun 9-30 | 10 | 87 | 3 |
| 2002 Dec 9-2003 Feb 11 | 10 | 84 | 6 |
| 2001 Mar 23-May 16 | 12 | 83 | 5 |
| 1999 Sep 24-Nov 16 | 11 | 85 | 4 |
| 1998 Aug 13-Oct 26 | 10 | 86 | 4 |
| 1997 Jan 4-Feb 28 | 16 | 79 | 5 |
| Black adults | |||
| 2021 Jun 1-Jul 5 | 47 | 53 | -- |
| 2020 Jun 8-Jul 24 | 47 | 52 | 1 |
| 2018 Nov 19-Dec 22 | 50 | 49 | 1 |
| 2016 Jun 7-Jul 1 | 37 | 61 | 2 |
| 2015 Jun 15-Jul 10 | 42 | 57 | 2 |
| 2007 Jun 4-24 | 40 | 56 | 4 |
| 2004 Jun 9-30 | 37 | 59 | 4 |
| 2002 Dec 9-2003 Feb 11 | 38 | 56 | 6 |
| 2001 Mar 23-May 16 | 39 | 56 | 5 |
| 1999 Sep 24-Nov 16 | 39 | 56 | 5 |
| 1998 Aug 13-Oct 26 | 34 | 60 | 6 |
| 1997 Jan 4-Feb 28 | 42 | 52 | 6 |
| Hispanic adults | |||
| 2021 Jun 1-Jul 5 | 33 | 67 | * |
| 2018 Nov 19-Dec 22 | 37 | 61 | 2 |
| 2016 Jun 7-Jul 1 | 30 | 67 | 3 |
| 2015 Jun 15-Jul 10 | 28 | 69 | 3 |
| 2007 Jun 4-24 | 29 | 68 | 3 |
| 2004 Jun 9-30 | 24 | 70 | 6 |
| Gallup | |||
Just your impression, are Black people in your community treated less fairly than White people in the following situations? How about -- in dealing with the police, such as traffic incidents?
| Yes, treated less fairly | No, not treated less fairly | No opinion | |
|---|---|---|---|
| % | % | % | |
| National adults | |||
| 2021 Jun 1-Jul 5 | 55 | 44 | 1 |
| 2020 Jun 8-Jul 24 | 55 | 44 | 1 |
| 2018 Nov 19-Dec 22 | 52 | 45 | 3 |
| 2016 Jun 7-Jul 1 | 45 | 51 | 4 |
| 2015 Jun 15-Jul 10 | 43 | 54 | 3 |
| 2007 Jun 4-24 | 37 | 55 | 8 |
| 2004 Jun 9-30 | 38 | 53 | 9 |
| 2002 Dec 9-2003 Feb 11 | 39 | 50 | 11 |
| 2001 Mar 23-May 16 | 39 | 51 | 10 |
| 1999 Sep 24-Nov 16 | 35 | 54 | 11 |
| 1998 Aug 13-Oct 26 | 33 | 57 | 10 |
| 1997 Jan 4-Feb 28 | 34 | 51 | 15 |
| White adults | |||
| 2021 Jun 1-Jul 5 | 50 | 49 | 2 |
| 2020 Jun 8-Jul 24 | 48 | 50 | 2 |
| 2018 Nov 19-Dec 22 | 45 | 52 | 4 |
| 2016 Jun 7-Jul 1 | 40 | 55 | 5 |
| 2015 Jun 15-Jul 10 | 34 | 63 | 3 |
| 2007 Jun 4-24 | 31 | 60 | 9 |
| 2004 Jun 9-30 | 32 | 59 | 9 |
| 2002 Dec 9-2003 Feb 11 | 35 | 54 | 11 |
| 2001 Mar 23-May 16 | 35 | 54 | 11 |
| 1999 Sep 24-Nov 16 | 30 | 59 | 11 |
| 1998 Aug 13-Oct 26 | 29 | 61 | 10 |
| 1997 Jan 4-Feb 28 | 30 | 54 | 16 |
| Black adults | |||
| 2021 Jun 1-Jul 5 | 80 | 20 | * |
| 2020 Jun 8-Jul 24 | 79 | 21 | * |
| 2018 Nov 19-Dec 22 | 77 | 21 | 2 |
| 2016 Jun 7-Jul 1 | 67 | 32 | 1 |
| 2015 Jun 15-Jul 10 | 73 | 26 | 2 |
| 2007 Jun 4-24 | 73 | 24 | 4 |
| 2004 Jun 9-30 | 66 | 28 | 6 |
| 2002 Dec 9-2003 Feb 11 | 69 | 27 | 4 |
| 2001 Mar 23-May 16 | 66 | 30 | 4 |
| 1999 Sep 24-Nov 16 | 64 | 31 | 5 |
| 1998 Aug 13-Oct 26 | 55 | 38 | 7 |
| 1997 Jan 4-Feb 28 | 60 | 33 | 7 |
| Hispanic adults | |||
| 2021 Jun 1-Jul 5 | 54 | 46 | * |
| 2018 Nov 19-Dec 22 | 60 | 36 | 4 |
| 2016 Jun 7-Jul 1 | 45 | 52 | 3 |
| 2015 Jun 15-Jul 10 | 54 | 42 | 4 |
| 2007 Jun 4-24 | 51 | 42 | 6 |
| 2004 Jun 9-30 | 47 | 45 | 8 |
| Gallup | |||
Just your impression, are Black people in your community treated less fairly than White people in the following situations? How about -- in getting healthcare from doctors and hospitals?
| Yes, treated less fairly | No, not treated less fairly | No opinion | |
|---|---|---|---|
| % | % | % | |
| National adults | |||
| 2021 Jun 1-Jul 5 | 33 | 66 | 1 |
| 2020 Jun 8-Jul 24 | 31 | 67 | 2 |
| 2018 Nov 19-Dec 22 | 24 | 71 | 5 |
| 2016 Jun 7-Jul 1 | 18 | 75 | 6 |
| 2015 Jun 15-Jul 10 | 20 | 77 | 3 |
| 2004 Jun 9-30 | 17 | 74 | 9 |
| White adults | |||
| 2021 Jun 1-Jul 5 | 27 | 71 | 1 |
| 2020 Jun 8-Jul 24 | 26 | 73 | 2 |
| 2018 Nov 19-Dec 22 | 17 | 77 | 6 |
| 2016 Jun 7-Jul 1 | 13 | 80 | 8 |
| 2015 Jun 15-Jul 10 | 14 | 82 | 3 |
| 2004 Jun 9-30 | 13 | 78 | 9 |
| Black adults | |||
| 2021 Jun 1-Jul 5 | 64 | 36 | -- |
| 2020 Jun 8-Jul 24 | 55 | 43 | 2 |
| 2018 Nov 19-Dec 22 | 49 | 49 | 1 |
| 2016 Jun 7-Jul 1 | 39 | 59 | 2 |
| 2015 Jun 15-Jul 10 | 45 | 54 | 1 |
| 2004 Jun 9-30 | 38 | 58 | 4 |
| Hispanic adults | |||
| 2021 Jun 1-Jul 5 | 31 | 68 | 1 |
| 2018 Nov 19-Dec 22 | 32 | 64 | 4 |
| 2016 Jun 7-Jul 1 | 25 | 71 | 4 |
| 2015 Jun 15-Jul 10 | 23 | 73 | 4 |
| 2004 Jun 9-30 | 28 | 67 | 5 |
| Gallup | |||
Do you feel that women in this country have equal job opportunities as men, or not?
| Yes | No | No opinion | |
|---|---|---|---|
| % | % | % | |
| National adults | |||
| 2021 Jun 1-Jul 5 | 47 | 53 | 1 |
| 2018 Nov 19-Dec 22 | 50 | 49 | 1 |
| 2016 Jun 7-Jul 1 | 52 | 48 | 1 |
| 2008 Jun 5-Jul 6 | 57 | 42 | 1 |
| 2007 Jun 4-24 | 57 | 43 | * |
| 2006 Jun 8-25 | 49 | 49 | 2 |
| 2005 Jun 6-25 | 53 | 46 | 1 |
| 2003 Jun 12-18 | 49 | 50 | 1 |
| 2002 Jun 3-9 | 46 | 53 | 1 |
| 2001 Jun 11-17 | 42 | 57 | 1 |
| 1995 Sep 14-17 | 34 | 64 | 2 |
| 1993 Aug 23-25 | 39 | 60 | 1 |
| 1989 Dec 18-21 | 42 | 56 | 2 |
| 1987 Jan 26-Feb 5 | 48 | 46 | 6 |
| 1976 Jan | 48 | 48 | 4 |
| Women | |||
| 2021 Jun 1-Jul 5 | 33 | 67 | * |
| 2018 Nov 19-Dec 22 | 40 | 60 | * |
| 2016 Jun 7-Jul 1 | 43 | 57 | * |
| 2008 Jun 5-Jul 6 | 45 | 54 | 1 |
| 2007 Jun 4-24 | 51 | 49 | * |
| 2006 Jun 8-25 | 40 | 58 | 2 |
| 2005 Jun 6-25 | 45 | 55 | * |
| 2003 Jun 12-18 | 43 | 56 | 1 |
| 2002 Jun 3-9 | 39 | 60 | 1 |
| 2001 Jun 11-17 | 32 | 67 | 1 |
| 1995 Sep 14-17 | 30 | 69 | 3 |
| 1993 Aug 23-25 | 30 | 69 | 1 |
| 1989 Dec 18-21 | 37 | 60 | 3 |
| 1987 Jan 26-Feb 5 | 35 | 56 | 9 |
| Men | |||
| 2021 Jun 1-Jul 5 | 61 | 38 | 1 |
| 2018 Nov 19-Dec 22 | 61 | 38 | 1 |
| 2016 Jun 7-Jul 1 | 61 | 38 | 1 |
| 2008 Jun 5-Jul 6 | 71 | 28 | 1 |
| 2007 Jun 4-24 | 63 | 36 | * |
| 2006 Jun 8-25 | 59 | 39 | 2 |
| 2005 Jun 6-25 | 61 | 37 | 2 |
| 2003 Jun 12-18 | 55 | 44 | 1 |
| 2002 Jun 3-9 | 54 | 45 | 1 |
| 2001 Jun 11-17 | 53 | 46 | 1 |
| 1995 Sep 14-17 | 38 | 59 | 3 |
| 1993 Aug 23-25 | 50 | 50 | * |
| 1989 Dec 18-21 | 46 | 52 | 2 |
| 1987 Jan 26-Feb 5 | 48 | 46 | 6 |
| * Less than 0.5% | |||
| Gallup | |||
Do you feel that racial minorities in this country have equal job opportunities as White people, or not?
| Yes | No | No opinion | |
|---|---|---|---|
| % | % | % | |
| National adults | |||
| 2021 Jun 1-Jul 5 | 40 | 59 | 1 |
| 2018 Nov 19-Dec 22 | 45 | 54 | 1 |
| 2016 Jun 7-Jul 1 | 47 | 52 | 1 |
| 2008 Jun 5-Jul 6 | 53 | 46 | 1 |
| 2007 Jun 4-24 | 52 | 45 | 3 |
| 2006 Jun 8-25 | 46 | 53 | 1 |
| 2005 Jun 6-25 | 53 | 45 | 2 |
| 2003 Jun 12-18 | 49 | 49 | 2 |
| 2002 Jun 3-9 | 48 | 49 | 3 |
| 2001 Jun 12-17 | 48 | 50 | 2 |
| White adults | |||
| 2021 Jun 1-Jul 5 | 46 | 54 | 1 |
| 2018 Nov 19-Dec 22 | 51 | 48 | 2 |
| 2016 Jun 7-Jul 1 | 52 | 47 | 1 |
| 2008 Jun 5-Jul 6 | 60 | 39 | 1 |
| 2007 Jun 4-24 | 57 | 40 | 3 |
| 2006 Jun 8-25 | 53 | 47 | 1 |
| 2005 Jun 6-25 | 59 | 39 | 2 |
| 2003 Jun 12-15 | 55 | 43 | 2 |
| 2002 Jun 3-6 | 54 | 43 | 3 |
| 2001 Jun 12-17 | 53 | 45 | 2 |
| Black adults | |||
| 2021 Jun 1-Jul 5 | 14 | 86 | * |
| 2018 Nov 19-Dec 22 | 19 | 80 | 1 |
| 2016 Jun 7-Jul 1 | 20 | 78 | 2 |
| 2008 Jun 5-Jul 6 | 24 | 75 | 2 |
| 2007 Jun 4-24 | 23 | 76 | 1 |
| 2006 Jun 8-25 | 17 | 81 | 2 |
| 2005 Jun 6-25 | 23 | 76 | 1 |
| 2003 Jun 12-18 | 17 | 81 | 2 |
| 2002 Jun 3-9 | 19 | 80 | 1 |
| 2001 Jun 12-17 | 18 | 79 | 3 |
| Hispanic adults | |||
| 2021 Jun 1-Jul 5 | 42 | 57 | 1 |
| 2018 Nov 19-Dec 22 | 43 | 57 | 1 |
| 2016 Jun 7-Jul 1 | 44 | 55 | 1 |
| 2008 Jun 5-Jul 6 | 45 | 55 | * |
| 2007 Jun 4-24 | 43 | 55 | 1 |
| 2006 Jun 8-25 | 34 | 62 | 3 |
| 2005 Jun 6-25 | 45 | 53 | 2 |
| 2003 Jun 12-18 | 39 | 58 | 3 |
| 2002 Jun 3-9 | 41 | 55 | 4 |
| 2001 Jun 12-17 | 46 | 51 | 3 |
| * Less than 0.5% | |||
| Gallup | |||
Do you generally favor or oppose affirmative action programs for women?
| Favor | Oppose | No opinion | |
|---|---|---|---|
| % | % | % | |
| National adults | |||
| 2021 Jun 1-Jul 5 | 66 | 30 | 4 |
| 2018 Nov 19-Dec 22 | 65 | 27 | 8 |
| 2016 Jun 7-Jul 1 | 60 | 34 | 6 |
| 2005 Jun 6-25 | 59 | 34 | 7 |
| 2003 Jun 12-18 | 59 | 34 | 7 |
| 2001 Jun 11-17 | 53 | 38 | 9 |
| White adults | |||
| 2021 Jun 1-Jul 5 | 60 | 35 | 5 |
| 2018 Nov 19-Dec 22 | 61 | 31 | 8 |
| 2016 Jun 7-Jul 1 | 55 | 40 | 5 |
| 2005 Jun 6-25 | 52 | 42 | 6 |
| 2003 Jun 12-15 | 55 | 38 | 7 |
| 2001 Jun 11-17 | 50 | 42 | 8 |
| Black adults | |||
| 2021 Jun 1-Jul 5 | 70 | 25 | 6 |
| 2018 Nov 19-Dec 22 | 77 | 17 | 6 |
| 2016 Jun 7-Jul 1 | 81 | 15 | 4 |
| 2005 Jun 6-25 | 80 | 15 | 5 |
| 2003 Jun 12-18 | 77 | 15 | 8 |
| 2001 Jun 11-17 | 77 | 15 | 8 |
| Hispanic adults | |||
| 2021 Jun 1-Jul 5 | 83 | 14 | 3 |
| 2018 Nov 19-Dec 22 | 72 | 16 | 12 |
| 2016 Jun 7-Jul 1 | 69 | 20 | 11 |
| 2005 Jun 6-25 | 76 | 15 | 9 |
| 2003 Jun 12-18 | 69 | 22 | 9 |
| 2001 Jun 11-17 | 72 | 17 | 11 |
| Men | |||
| 2021 Jun 1-Jul 5 | 61 | 35 | 4 |
| 2018 Nov 19-Dec 22 | 61 | 31 | 8 |
| 2016 Jun 7-Jul 1 | 55 | 40 | 5 |
| 2005 Jun 6-25 | 53 | 42 | 5 |
| 2003 Jun 12-18 | 56 | 39 | 5 |
| 2001 Jun 11-17 | 49 | 43 | 8 |
| Women | |||
| 2021 Jun 1-Jul 5 | 72 | 24 | 4 |
| 2018 Nov 19-Dec 22 | 69 | 23 | 9 |
| 2016 Jun 7-Jul 1 | 64 | 29 | 8 |
| 2005 Jun 6-25 | 65 | 27 | 8 |
| 2003 Jun 12-18 | 62 | 29 | 9 |
| 2001 Jun 11-17 | 57 | 34 | 9 |
| Gallup | |||
Do you generally favor or oppose affirmative action programs for racial minorities?
| Favor | Oppose | No opinion | |
|---|---|---|---|
| % | % | % | |
| National adults | |||
| 2021 Jun 1-Jul 5 | 62 | 33 | 4 |
| 2018 Nov 19-Dec 22 | 61 | 30 | 9 |
| 2016 Jun 7-Jul 1 | 54 | 40 | 6 |
| 2005 Jun 6-25 | 50 | 42 | 8 |
| 2003 Jun 12-18 | 49 | 43 | 8 |
| 2001 Jun 11-17 | 47 | 44 | 9 |
| White adults | |||
| 2021 Jun 1-Jul 5 | 57 | 38 | 5 |
| 2018 Nov 19-Dec 22 | 57 | 34 | 8 |
| 2016 Jun 7-Jul 1 | 48 | 46 | 6 |
| 2005 Jun 6-25 | 44 | 49 | 7 |
| 2003 Jun 12-15 | 44 | 49 | 7 |
| 2001 Jun 11-17 | 44 | 48 | 8 |
| Black adults | |||
| 2021 Jun 1-Jul 5 | 69 | 25 | 5 |
| 2018 Nov 19-Dec 22 | 72 | 21 | 7 |
| 2016 Jun 7-Jul 1 | 75 | 21 | 4 |
| 2013 Jun 13-Jul 5 | 76 | 20 | 5 |
| 2005 Jun 6-25 | 72 | 21 | 7 |
| 2003 Jun 12-18 | 70 | 21 | 9 |
| 2001 Jun 11-17 | 69 | 23 | 8 |
| Hispanic adults | |||
| 2021 Jun 1-Jul 5 | 79 | 18 | 4 |
| 2018 Nov 19-Dec 22 | 66 | 22 | 13 |
| 2016 Jun 7-Jul 1 | 63 | 29 | 8 |
| 2005 Jun 6-25 | 62 | 25 | 13 |
| 2003 Jun 12-18 | 63 | 28 | 9 |
| 2001 Jun 11-17 | 64 | 23 | 13 |
| Gallup | |||
Thinking back over your lifetime, how do you feel civil rights for Black people have changed in this country -- would you say the situation has greatly improved, somewhat improved, stayed pretty much the same, somewhat worsened or greatly worsened?
| Greatly improved | Somewhat improved | Stayed the same | Somewhat worsened | Greatly worsened | No opinion | |
|---|---|---|---|---|---|---|
| % | % | % | % | % | % | |
| National adults | ||||||
| 2021 Jun 1-Jul 5 | 25 | 44 | 16 | 9 | 6 | * |
| 2020 Jun 8-Jul 24 | 19 | 40 | 22 | 11 | 7 | * |
| 2016 Jun 7-Jul 1 | 34 | 41 | 12 | 8 | 5 | * |
| 2015 Jun 15-Jul 10 | 38 | 38 | 13 | 7 | 3 | 1 |
| 2013 Jun 13-Jul 5 | 48 | 39 | 9 | 3 | 1 | * |
| 2011 Aug 4-7 | 50 | 39 | 8 | 1 | 2 | 1 |
| 2003 Jun 12-18 | 45 | 42 | 9 | 3 | * | 1 |
| 1995 Oct 19-22 | 32 | 51 | 9 | 5 | 2 | 1 |
| White adults | ||||||
| 2021 Jun 1-Jul 5 | 26 | 44 | 16 | 8 | 5 | 1 |
| 2020 Jun 8-Jul 24 | 21 | 44 | 20 | 10 | 6 | * |
| 2016 Jun 7-Jul 1 | 37 | 40 | 11 | 7 | 5 | * |
| 2015 Jun 15-Jul 10 | 43 | 36 | 12 | 6 | 2 | * |
| 2013 Jun 13-Jul 5 | 54 | 35 | 7 | 2 | 1 | * |
| 2011 Aug 4-7 | 53 | 37 | 8 | 1 | 1 | 1 |
| 2003 Jun 12-15 | 48 | 41 | 8 | 2 | * | 1 |
| 1995 Oct 19-22 | 34 | 51 | 8 | 5 | 1 | 1 |
| Black adults | ||||||
| 2021 Jun 1-Jul 5 | 18 | 39 | 17 | 16 | 11 | -- |
| 2020 Jun 8-Jul 24 | 10 | 42 | 24 | 13 | 11 | -- |
| 2016 Jun 7-Jul 1 | 20 | 49 | 14 | 12 | 5 | -- |
| 2015 Jun 15-Jul 10 | 21 | 49 | 13 | 10 | 7 | 1 |
| 2013 Aug 9-22 | 25 | 55 | 11 | 7 | 2 | * |
| 2013 Jun 13-Jul 5 | 29 | 52 | 11 | 6 | 1 | 1 |
| 2011 Aug 4-7 | 29 | 56 | 9 | 4 | 2 | * |
| 2003 Jun 12-18 | 25 | 46 | 13 | 13 | 1 | 2 |
| 1995 Oct 19-22 | 25 | 51 | 14 | 7 | 2 | 1 |
| Hispanic adults | ||||||
| 2021 Jun 1-Jul 5 | 25 | 45 | 14 | 10 | 7 | * |
| 2016 Jun 7-Jul 1 | 32 | 40 | 16 | 7 | 4 | 1 |
| 2015 Jun 15-Jul 10 | 34 | 33 | 17 | 10 | 5 | 1 |
| 2013 Jun 13-Jul 5 | 42 | 41 | 13 | 1 | 1 | 1 |
| 2003 Jun 12-18 | 35 | 47 | 12 | 3 | 1 | 2 |
| * Less than 0.5% | ||||||
| Gallup | ||||||
Do you think racism against Black people is or is not widespread in the U.S.?
| Yes, widespread | No, not | No opinion | |
|---|---|---|---|
| % | % | % | |
| National adults | |||
| 2021 Jun 1-Jul 5 | 64 | 35 | * |
| 2016 Jun 7-Jul 1 | 61 | 38 | 1 |
| 2015 Jun 15-Jul 10 | 60 | 39 | 1 |
| 2009 Oct 16-19 | 51 | 46 | 3 |
| 2008 Jun 5-Jul 6 | 56 | 42 | 3 |
| White adults | |||
| 2021 Jun 1-Jul 5 | 59 | 40 | 1 |
| 2016 Jun 7-Jul 1 | 56 | 43 | 1 |
| 2015 Jun 15-Jul 10 | 55 | 45 | 1 |
| 2009 Oct 16-19 | 49 | 48 | 3 |
| 2008 Jun 5-Jul 6 | 51 | 46 | 3 |
| Black adults | |||
| 2021 Jun 1-Jul 5 | 84 | 16 | -- |
| 2016 Jun 7-Jul 1 | 82 | 16 | 1 |
| 2015 Jun 15-Jul 10 | 80 | 19 | * |
| 2009 Oct 16-19 | 72 | 26 | 2 |
| 2008 Jun 5-Jul 6 | 78 | 20 | 2 |
| Hispanic adults | |||
| 2021 Jun 1-Jul 5 | 72 | 28 | -- |
| 2016 Jun 7-Jul 1 | 66 | 31 | 3 |
| 2015 Jun 15-Jul 10 | 64 | 35 | 1 |
| 2008 Jun 5-Jul 6 | 59 | 38 | 3 |
| * Less than 0.5% | |||
| Gallup | |||
Can you think of any occasion in the last 30 days when you felt you were treated unfairly in the following places because you were a Black person? How about -- [RANDOM ORDER]?
Among Black adults
| Yes, treated unfairly | No, not | No opinion | |
|---|---|---|---|
| % | % | % | |
| At your place of work | |||
| 2021 Jun 1-Jul 5 | 17 | 71 | 12 |
| 2020 Jun 8-Jul 24 | 17 | 71 | 12 |
| 2018 Nov 19-Dec 22 | 19 | 74 | 8 |
| 2016 Jun 7-Jul 1 | 19 | 74 | 7 |
| 2015 Jun 15-Jul 10 | 18 | 74 | 8 |
| 2013 Jun 13-Jul 5 | 15 | 81 | 4 |
| 2007 Jun 4-24 | 23 | 62 | 15 |
| 2004 Jun 9-30 | 22 | 61 | 17 |
| 2002 Dec 9-2003 Feb 11 | 23 | 54 | 23 |
| 2001 Mar 23-May 16 | 19 | 65 | 16 |
| 1999 Sep 24-Nov 16 | 19 | 63 | 18 |
| 1998 Aug 13-Oct 26 | 18 | 63 | 19 |
| 1997 Jan 4-Feb 28 | 21 | 77 | 2 |
| In a store where you were shopping | |||
| 2021 Jun 1-Jul 5 | 35 | 65 | * |
| 2020 Jun 8-Jul 24 | 24 | 75 | 1 |
| 2018 Nov 19-Dec 22 | 29 | 69 | 2 |
| 2016 Jun 7-Jul 1 | 25 | 74 | 1 |
| 2015 Jun 15-Jul 10 | 24 | 75 | * |
| 2013 Jun 13-Jul 5 | 24 | 76 | * |
| 2007 Jun 4-24 | 28 | 69 | 3 |
| 2004 Jun 9-30 | 28 | 71 | 1 |
| 2002 Dec 9-2003 Feb 11 | 28 | 70 | 2 |
| 2001 Mar 23-May 16 | 27 | 71 | 2 |
| 1999 Sep 24-Nov 16 | 27 | 70 | 3 |
| 1998 Aug 13-Oct 26 | 26 | 72 | 2 |
| 1997 Jan 4-Feb 28 | 30 | 70 | -- |
| In a restaurant, bar, theater or other entertainment place | |||
| 2021 Jun 1-Jul 5 | 21 | 72 | 6 |
| 2020 Jun 8-Jul 24 | 18 | 75 | 8 |
| 2018 Nov 19-Dec 22 | 23 | 74 | 3 |
| 2016 Jun 7-Jul 1 | 19 | 78 | 2 |
| 2015 Jun 15-Jul 10 | 20 | 79 | 2 |
| 2013 Jun 13-Jul 5 | 16 | 84 | * |
| 2007 Jun 4-24 | 20 | 76 | 4 |
| 2004 Jun 9-30 | 26 | 69 | 5 |
| 2002 Dec 9-2003 Feb 11 | 24 | 69 | 7 |
| 2001 Mar 23-May 16 | 20 | 75 | 5 |
| 1999 Sep 24-Nov 16 | 19 | 75 | 6 |
| 1998 Aug 13-Oct 26 | 16 | 76 | 8 |
| 1997 Jan 4-Feb 28 | 21 | 76 | 3 |
| In dealing with the police, such as traffic incidents | |||
| 2021 Jun 1-Jul 5 | 20 | 72 | 8 |
| 2020 Jun 8-Jul 24 | 19 | 73 | 8 |
| 2018 Nov 19-Dec 22 | 21 | 73 | 6 |
| 2016 Jun 7-Jul 1 | 16 | 78 | 7 |
| 2015 Jun 15-Jul 10 | 18 | 78 | 4 |
| 2013 Jun 13-Jul 5 | 17 | 81 | 3 |
| 2007 Jun 4-24 | 21 | 66 | 13 |
| 2004 Jun 9-30 | 25 | 66 | 9 |
| 2002 Dec 9-2003 Feb 11 | 22 | 63 | 15 |
| 2001 Mar 23-May 16 | 21 | 67 | 12 |
| 1999 Sep 24-Nov 16 | 20 | 66 | 14 |
| 1998 Aug 13-Oct 26 | 16 | 65 | 19 |
| 1997 Jan 4-Feb 28 | 15 | 79 | 6 |
| While getting healthcare for yourself or a family member | |||
| 2021 Jun 1-Jul 5 | 17 | 82 | 1 |
| 2020 Jun 8-Jul 24 | 13 | 82 | 4 |
| 2018 Nov 19-Dec 22 | 16 | 82 | 2 |
| 2016 Jun 7-Jul 1 | 12 | 85 | 3 |
| 2015 Jun 15-Jul 10 | 12 | 86 | 2 |
| 2013 Jun 13-Jul 5 | 9 | 90 | 1 |
| 2004 Jun 9-30 | 20 | 77 | 3 |
| * Less than 0.5% | |||
| Gallup | |||
Can you think of any occasion in the last 30 days when you felt you were treated unfairly in the following places because you were Hispanic? How about -- [RANDOM ORDER]?
| Yes, treated unfairly | No, not | No opinion | |
|---|---|---|---|
| % | % | % | |
| At your place of work | |||
| 2021 Jun 1-Jul 5 | 12 | 85 | 3 |
| 2015 Jun 15-Jul 10 | 11 | 85 | 4 |
| 2013 Jun 13-Jul 5 | 15 | 82 | 3 |
| In a store where you were shopping | |||
| 2021 Jun 1-Jul 5 | 16 | 84 | * |
| 2015 Jun 15-Jul 10 | 7 | 93 | * |
| 2013 Jun 13-Jul 5 | 19 | 81 | * |
| In a restaurant, bar, theater or other entertainment place | |||
| 2021 Jun 1-Jul 5 | 19 | 79 | 2 |
| 2015 Jun 15-Jul 10 | 9 | 90 | 1 |
| 2013 Jun 13-Jul 5 | 15 | 84 | * |
| In dealings with the police, such as traffic incidents | |||
| 2021 Jun 1-Jul 5 | 11 | 84 | 5 |
| 2015 Jun 15-Jul 10 | 10 | 85 | 5 |
| 2013 Jun 13-Jul 5 | 16 | 82 | 3 |
| While getting healthcare for yourself or a family member | |||
| 2021 Jun 1-Jul 5 | 13 | 86 | * |
| 2015 Jun 15-Jul 10 | 9 | 90 | 1 |
| 2013 Jun 13-Jul 5 | 16 | 83 | 1 |
| * Less than 0.5% | |||
| Gallup | |||
The terms "Black" and "African American" are both used to refer to this racial subgroup of Americans. Which term do you think should generally be used -- Black, African American, another term, or does it not matter to you either way? (Asked of those with no preference for Black or African American as the racial group description:) If you had to choose, which term do you lean toward -- "African American" or "Black"?
| Black | African American | No opinion | |
|---|---|---|---|
| % | % | % | |
| 2021 Jun 1-Jul 5 | 52 | 44 | 4 |
| Gallup | |||
The terms "Hispanic," "Latino" and "LatinX" are used to refer to this ethnic subgroup of Americans. Which term do you think should generally be used -- Hispanic, Latino, LatinX, another term, or does it not matter to you either way? (Asked of those with no preference as the racial group description:) If you had to choose, which term do you lean toward -- Hispanic, Latino or LatinX?
| Hispanic | Latino | LatinX | No opinion | |
|---|---|---|---|---|
| % | % | % | % | |
| 2021 Jun 1-Jul 5 | 57 | 37 | 5 | 2 |
| Gallup | ||||
In general, do you think that Black children have as good a chance as White children in your community to get a good education, or don't you think they have as good a chance?
| Yes, have as good a chance | No, do not | No opinion | ||||||||||||||||||||||||||||||||||||||||||||||||||||||||||||||||||||||||||||||||||||||||||||||||||
|---|---|---|---|---|---|---|---|---|---|---|---|---|---|---|---|---|---|---|---|---|---|---|---|---|---|---|---|---|---|---|---|---|---|---|---|---|---|---|---|---|---|---|---|---|---|---|---|---|---|---|---|---|---|---|---|---|---|---|---|---|---|---|---|---|---|---|---|---|---|---|---|---|---|---|---|---|---|---|---|---|---|---|---|---|---|---|---|---|---|---|---|---|---|---|---|---|---|---|---|---|
| % | % | % | ||||||||||||||||||||||||||||||||||||||||||||||||||||||||||||||||||||||||||||||||||||||||||||||||||
| National adults | ||||||||||||||||||||||||||||||||||||||||||||||||||||||||||||||||||||||||||||||||||||||||||||||||||||
| 2020 Jun 8-Jul 24 | 64 | 36 | * | |||||||||||||||||||||||||||||||||||||||||||||||||||||||||||||||||||||||||||||||||||||||||||||||||
| 2016 Jun 7-Jul 1 | 71 | 28 | 1 | |||||||||||||||||||||||||||||||||||||||||||||||||||||||||||||||||||||||||||||||||||||||||||||||||
| 2015 Jun 15-Jul 10 | 76 | 24 | * | |||||||||||||||||||||||||||||||||||||||||||||||||||||||||||||||||||||||||||||||||||||||||||||||||
| 2013 Jun 13-Jul 5 | 77 | 23 | 1 | |||||||||||||||||||||||||||||||||||||||||||||||||||||||||||||||||||||||||||||||||||||||||||||||||
| 2008 Jun 5-Jul 6 | 75 | 23 | 1 | |||||||||||||||||||||||||||||||||||||||||||||||||||||||||||||||||||||||||||||||||||||||||||||||||
| 2007 Jun 4-24 | 76 | 21 | 3 | |||||||||||||||||||||||||||||||||||||||||||||||||||||||||||||||||||||||||||||||||||||||||||||||||
| 2005 Jun 6-25 | 79 | 19 | 2 | |||||||||||||||||||||||||||||||||||||||||||||||||||||||||||||||||||||||||||||||||||||||||||||||||
| 2004 Jun 9-30 | 80 | 19 | 1 | |||||||||||||||||||||||||||||||||||||||||||||||||||||||||||||||||||||||||||||||||||||||||||||||||
| 2002 Dec 9-2003 Feb 11 | 77 | 20 | 3 | |||||||||||||||||||||||||||||||||||||||||||||||||||||||||||||||||||||||||||||||||||||||||||||||||
| 2001 Mar 23-May 16 | 80 | 18 | 2 | |||||||||||||||||||||||||||||||||||||||||||||||||||||||||||||||||||||||||||||||||||||||||||||||||
| 1999 Sep 24-Nov 16 | 82 | 15 | 3 | |||||||||||||||||||||||||||||||||||||||||||||||||||||||||||||||||||||||||||||||||||||||||||||||||
| 1997 May 30-Jun 1 | 76 | 21 | 3 | |||||||||||||||||||||||||||||||||||||||||||||||||||||||||||||||||||||||||||||||||||||||||||||||||
| 1995 Oct 19-22 | 82 | 14 | 4 | |||||||||||||||||||||||||||||||||||||||||||||||||||||||||||||||||||||||||||||||||||||||||||||||||
| 1991 Jun 13-16 | 81 | 15 | 4 | |||||||||||||||||||||||||||||||||||||||||||||||||||||||||||||||||||||||||||||||||||||||||||||||||
| 1990 Jun 7-10 | 83 | 11 | 6 | |||||||||||||||||||||||||||||||||||||||||||||||||||||||||||||||||||||||||||||||||||||||||||||||||
| 1989 Dec 7-10 | 80 | 15 | 5 | |||||||||||||||||||||||||||||||||||||||||||||||||||||||||||||||||||||||||||||||||||||||||||||||||
| 1962 Aug 23-28 ^ | 83 | 7 | 10 | |||||||||||||||||||||||||||||||||||||||||||||||||||||||||||||||||||||||||||||||||||||||||||||||||
| White adults | ||||||||||||||||||||||||||||||||||||||||||||||||||||||||||||||||||||||||||||||||||||||||||||||||||||
| 2020 Jun 8-Jul 24 | 64 | 35 | * | |||||||||||||||||||||||||||||||||||||||||||||||||||||||||||||||||||||||||||||||||||||||||||||||||
| 2016 Jun 7-Jul 1 | 75 | 24 | 1 | |||||||||||||||||||||||||||||||||||||||||||||||||||||||||||||||||||||||||||||||||||||||||||||||||
| 2015 Jun 15-Jul 10 | 81 | 19 | * | |||||||||||||||||||||||||||||||||||||||||||||||||||||||||||||||||||||||||||||||||||||||||||||||||
| 2013 Jun 13-Jul 5 | 80 | 19 | * | |||||||||||||||||||||||||||||||||||||||||||||||||||||||||||||||||||||||||||||||||||||||||||||||||
| 2008 Jun 5-Jul 6 | 80 | 19 | 1 | |||||||||||||||||||||||||||||||||||||||||||||||||||||||||||||||||||||||||||||||||||||||||||||||||
| 2007 Jun 4-24 | 80 | 16 | 3 | |||||||||||||||||||||||||||||||||||||||||||||||||||||||||||||||||||||||||||||||||||||||||||||||||
| 2005 Jun 6-25 | 85 | 13 | 2 | |||||||||||||||||||||||||||||||||||||||||||||||||||||||||||||||||||||||||||||||||||||||||||||||||
| 2004 Jun 9-30 | 86 | 14 | * | |||||||||||||||||||||||||||||||||||||||||||||||||||||||||||||||||||||||||||||||||||||||||||||||||
| 2002 Dec 9-2003 Feb 11 | 81 | 17 | 2 | |||||||||||||||||||||||||||||||||||||||||||||||||||||||||||||||||||||||||||||||||||||||||||||||||
| 2001 Mar 23-May 16 | 85 | 13 | 2 | |||||||||||||||||||||||||||||||||||||||||||||||||||||||||||||||||||||||||||||||||||||||||||||||||
| 1999 Sep 24-Nov 16 | 86 | 12 | 2 | |||||||||||||||||||||||||||||||||||||||||||||||||||||||||||||||||||||||||||||||||||||||||||||||||
| 1997 May 30-Jun 1 | 79 | 18 | 3 | |||||||||||||||||||||||||||||||||||||||||||||||||||||||||||||||||||||||||||||||||||||||||||||||||
| 1995 Oct 19-22 | 85 | 11 | 4 | |||||||||||||||||||||||||||||||||||||||||||||||||||||||||||||||||||||||||||||||||||||||||||||||||
| 1991 Jun 13-16 | 83 | 13 | 4 | |||||||||||||||||||||||||||||||||||||||||||||||||||||||||||||||||||||||||||||||||||||||||||||||||
| 1990 Jun 7-10 | 85 | 9 | 6 | |||||||||||||||||||||||||||||||||||||||||||||||||||||||||||||||||||||||||||||||||||||||||||||||||
| 1989 Dec 7-10 | 82 | 13 | 5 | |||||||||||||||||||||||||||||||||||||||||||||||||||||||||||||||||||||||||||||||||||||||||||||||||
| 1962 Aug 23-28 ^ | 85 | 4 | 10 | |||||||||||||||||||||||||||||||||||||||||||||||||||||||||||||||||||||||||||||||||||||||||||||||||
| Black adults | ||||||||||||||||||||||||||||||||||||||||||||||||||||||||||||||||||||||||||||||||||||||||||||||||||||
| 2020 Jun 8-Jul 24 | 38 | 61 | 1 | |||||||||||||||||||||||||||||||||||||||||||||||||||||||||||||||||||||||||||||||||||||||||||||||||
| 2016 Jun 7-Jul 1 | 49 | 50 | 1 | |||||||||||||||||||||||||||||||||||||||||||||||||||||||||||||||||||||||||||||||||||||||||||||||||
| 2015 Jun 15-Jul 10 | 52 | 47 | * | |||||||||||||||||||||||||||||||||||||||||||||||||||||||||||||||||||||||||||||||||||||||||||||||||
| 2013 Aug 9-22 | 56 | 43 | 1 | |||||||||||||||||||||||||||||||||||||||||||||||||||||||||||||||||||||||||||||||||||||||||||||||||
| 2013 Jun 13-Jul 5 | 55 | 44 | 1 | |||||||||||||||||||||||||||||||||||||||||||||||||||||||||||||||||||||||||||||||||||||||||||||||||
| 2008 Jun 5-Jul 6 | 49 | 49 | 2 | |||||||||||||||||||||||||||||||||||||||||||||||||||||||||||||||||||||||||||||||||||||||||||||||||
| 2007 Jun 4-24 | 49 | 51 | * | |||||||||||||||||||||||||||||||||||||||||||||||||||||||||||||||||||||||||||||||||||||||||||||||||
| 2005 Jun 6-25 | 51 | 47 | 2 | |||||||||||||||||||||||||||||||||||||||||||||||||||||||||||||||||||||||||||||||||||||||||||||||||
| 2004 Jun 9-30 | 51 | 48 | 1 | |||||||||||||||||||||||||||||||||||||||||||||||||||||||||||||||||||||||||||||||||||||||||||||||||
| 2002 Dec 9-2003 Feb 11 | 50 | 49 | 1 | |||||||||||||||||||||||||||||||||||||||||||||||||||||||||||||||||||||||||||||||||||||||||||||||||
| 2001 Mar 23-May 16 | 52 | 46 | 2 | |||||||||||||||||||||||||||||||||||||||||||||||||||||||||||||||||||||||||||||||||||||||||||||||||
| 1999 Sep 24-Nov 16 | 56 | 39 | 5 | |||||||||||||||||||||||||||||||||||||||||||||||||||||||||||||||||||||||||||||||||||||||||||||||||
| 1997 May 30-Jun 1 | 63 | 35 | 2 | |||||||||||||||||||||||||||||||||||||||||||||||||||||||||||||||||||||||||||||||||||||||||||||||||
| 1995 Oct 19-22 | 64 | 33 | 3 | |||||||||||||||||||||||||||||||||||||||||||||||||||||||||||||||||||||||||||||||||||||||||||||||||
| 1991 Jun 13-16 | 56 | 38 | 6 | |||||||||||||||||||||||||||||||||||||||||||||||||||||||||||||||||||||||||||||||||||||||||||||||||
| 1990 Jun 7-10 | 68 | 29 | 3 | |||||||||||||||||||||||||||||||||||||||||||||||||||||||||||||||||||||||||||||||||||||||||||||||||
| 1989 Dec 7-10 | 61 | 33 | 6 | |||||||||||||||||||||||||||||||||||||||||||||||||||||||||||||||||||||||||||||||||||||||||||||||||
| 1962 Aug 23-28^ | 53 | 41 | 6 | |||||||||||||||||||||||||||||||||||||||||||||||||||||||||||||||||||||||||||||||||||||||||||||||||
| Hispanic adults | ||||||||||||||||||||||||||||||||||||||||||||||||||||||||||||||||||||||||||||||||||||||||||||||||||||
| 2016 Jun 7-Jul 1 | 74 | 25 | 1 | |||||||||||||||||||||||||||||||||||||||||||||||||||||||||||||||||||||||||||||||||||||||||||||||||
| 2015 Jun 15-Jul 10 | 78 | 22 | * | |||||||||||||||||||||||||||||||||||||||||||||||||||||||||||||||||||||||||||||||||||||||||||||||||
| 2013 Jun 13-Jul 5 | 81 | 18 | 1 | |||||||||||||||||||||||||||||||||||||||||||||||||||||||||||||||||||||||||||||||||||||||||||||||||
| 2008 Jun 5-Jul 6 | 74 | 25 | 1 | |||||||||||||||||||||||||||||||||||||||||||||||||||||||||||||||||||||||||||||||||||||||||||||||||
| 2007 Jun 4-24 | 73 | 26 | * | |||||||||||||||||||||||||||||||||||||||||||||||||||||||||||||||||||||||||||||||||||||||||||||||||
| 2005 Jun 6-25 | 74 | 24 | 2 | |||||||||||||||||||||||||||||||||||||||||||||||||||||||||||||||||||||||||||||||||||||||||||||||||
| 2004 Jun 9-30 | 77 | 21 | 2 | |||||||||||||||||||||||||||||||||||||||||||||||||||||||||||||||||||||||||||||||||||||||||||||||||
| ^ WORDING: Negro children. Trends for Whites and Blacks from 2004-present exclude Hispanics; trends for Whites and Blacks from 1962-2002 include White and Black Hispanics. | ||||||||||||||||||||||||||||||||||||||||||||||||||||||||||||||||||||||||||||||||||||||||||||||||||||
| Gallup | ||||||||||||||||||||||||||||||||||||||||||||||||||||||||||||||||||||||||||||||||||||||||||||||||||||
Do you think new civil rights laws are needed to reduce discrimination against Black people, or not?
| Yes, needed | No, not needed | No opinion | |
|---|---|---|---|
| % | % | % | |
| National adults | |||
| 2020 Jun 8-Jul 24 | 61 | 39 | 1 |
| 2015 Jun 15-Jul 10 | 40 | 58 | 2 |
| 2013 Jun 13-Jul 5 | 27 | 71 | 2 |
| 2011 Aug 4-7 | 21 | 76 | 2 |
| 2003 Jun 12-18 | 26 | 70 | 4 |
| 1993 Aug 23-25 | 38 | 58 | 4 |
| White adults | |||
| 2020 Jun 8-Jul 24 | 53 | 46 | 1 |
| 2015 Jun 15-Jul 10 | 31 | 67 | 2 |
| 2013 Jun 13-Jul 5 | 17 | 81 | 2 |
| 2011 Aug 4-7 | 15 | 83 | 3 |
| 2003 Jun 12-18 | 20 | 77 | 3 |
| 1993 Aug 23-25 | 33 | 62 | 5 |
| Black adults | |||
| 2020 Jun 8-Jul 24 | 82 | 18 | -- |
| 2015 Jun 15-Jul 10 | 69 | 29 | 2 |
| 2013 Aug 9-22 | 61 | 38 | 1 |
| 2013 Jun 13-Jul 5 | 53 | 45 | 2 |
| 2011 Aug 4-7 | 52 | 48 | 1 |
| 2003 Jun 12-18 | 52 | 41 | 7 |
| 1993 Aug 23-25 | 70 | 26 | 4 |
| Hispanic adults | |||
| 2015 Jun 15-Jul 10 | 52 | 47 | * |
| 2013 Jun 13-Jul 5 | 46 | 52 | 1 |
| 2003 Jun 12-18 | 44 | 52 | 4 |
| * Less than 0.5% | |||
| Gallup | |||
Here is a list of actions Black people might take to improve their situation in this country. For each, please tell me if you think taking the action would help Black people, hurt Black people or if you think it would have no effect. How about -- Nonviolent protest?
| Help | Hurt | No effect | No opinion | |
|---|---|---|---|---|
| % | % | % | % | |
| National adults | ||||
| 2020 Jun 8-Jul 24 | 77 | 6 | 17 | 1 |
| 1988 Feb 19-22 | 68 | 8 | 18 | 5 |
| White adults | ||||
| 2020 Jun 8-Jul 24 | 78 | 5 | 16 | 1 |
| 1988 Feb 19-22 | 67 | 9 | 19 | 5 |
| Black adults | ||||
| 2020 Jun 8-Jul 24 | 72 | 7 | 20 | 1 |
| 1988 Feb 19-22 | 72 | 4 | 16 | 7 |
| Gallup | ||||
Here is a list of actions Black people might take to improve their situation in this country. For each, please tell me if you think taking the action would help Black people, hurt Black people or if you think it would have no effect. How about -- Legal action?
| Help | Hurt | No effect | No opinion | |
|---|---|---|---|---|
| % | % | % | % | |
| National adults | ||||
| 2020 Jun 8-Jul 24 | 66 | 11 | 22 | 2 |
| 1988 Feb 19-22 | 62 | 11 | 17 | 10 |
| White adults | ||||
| 2020 Jun 8-Jul 24 | 65 | 12 | 21 | 2 |
| 1988 Feb 19-22 | 60 | 12 | 18 | 10 |
| Black adults | ||||
| 2020 Jun 8-Jul 24 | 74 | 5 | 19 | 1 |
| 1988 Feb 19-22 | 79 | 3 | 10 | 8 |
| Gallup | ||||
Here is a list of actions Black people might take to improve their situation in this country. For each, please tell me if you think taking the action would help Black people, hurt Black people or if you think it would have no effect. How about -- Economic action such as boycotts?
| Help | Hurt | No effect | No opinion | |
|---|---|---|---|---|
| % | % | % | % | |
| National adults | ||||
| 2020 Jun 8-Jul 24 | 50 | 22 | 25 | 3 |
| 1988 Feb 19-22 | 29 | 29 | 31 | 11 |
| White adults | ||||
| 2020 Jun 8-Jul 24 | 48 | 24 | 27 | 1 |
| 1988 Feb 19-22 | 26 | 31 | 33 | 10 |
| Black adults | ||||
| 2020 Jun 8-Jul 24 | 69 | 11 | 19 | 1 |
| 1988 Feb 19-22 | 54 | 16 | 18 | 12 |
| Gallup | ||||
Here is a list of actions Black people might take to improve their situation in this country. For each, please tell me if you think taking the action would help Black people, hurt Black people or if you think it would have no effect. How about -- Violent protest?
| Help | Hurt | No effect | No opinion | |
|---|---|---|---|---|
| % | % | % | % | |
| National adults | ||||
| 2020 Jun 8-Jul 24 | 12 | 73 | 14 | * |
| 1988 Feb 19-22 | 4 | 79 | 15 | 3 |
| White adults | ||||
| 2020 Jun 8-Jul 24 | 9 | 79 | 12 | * |
| 1988 Feb 19-22 | 4 | 80 | 14 | 3 |
| Black adults | ||||
| 2020 Jun 8-Jul 24 | 21 | 59 | 19 | 1 |
| 1988 Feb 19-22 | 10 | 69 | 16 | 5 |
| * Less than 0.5% | ||||
| Gallup | ||||
How do you feel about those who are looting or committing property damage during protests on racial justice -- sympathetic, and believe their actions are justified; sympathetic, but believe their actions are not justified; or not sympathetic?
| Sympathetic/Justified | Sympathetic/Not justified | Not sympathetic | No opinion | |||||||||||||||||||||||||||||||||||||||||||||||||||||||||||||||||||||||||||||||||||||||||||||||||
|---|---|---|---|---|---|---|---|---|---|---|---|---|---|---|---|---|---|---|---|---|---|---|---|---|---|---|---|---|---|---|---|---|---|---|---|---|---|---|---|---|---|---|---|---|---|---|---|---|---|---|---|---|---|---|---|---|---|---|---|---|---|---|---|---|---|---|---|---|---|---|---|---|---|---|---|---|---|---|---|---|---|---|---|---|---|---|---|---|---|---|---|---|---|---|---|---|---|---|---|---|
| % | % | % | % | |||||||||||||||||||||||||||||||||||||||||||||||||||||||||||||||||||||||||||||||||||||||||||||||||
| National adults | ||||||||||||||||||||||||||||||||||||||||||||||||||||||||||||||||||||||||||||||||||||||||||||||||||||
| 2020 Jun 8-Jul 24 | 8 | 33 | 57 | 2 | ||||||||||||||||||||||||||||||||||||||||||||||||||||||||||||||||||||||||||||||||||||||||||||||||
| White adults | ||||||||||||||||||||||||||||||||||||||||||||||||||||||||||||||||||||||||||||||||||||||||||||||||||||
| 2020 Jun 8-Jul 24 | 8 | 30 | 60 | 2 | ||||||||||||||||||||||||||||||||||||||||||||||||||||||||||||||||||||||||||||||||||||||||||||||||
| Black adults | ||||||||||||||||||||||||||||||||||||||||||||||||||||||||||||||||||||||||||||||||||||||||||||||||||||
| 2020 Jun 8-Jul 24 | 12 | 48 | 38 | 2 | ||||||||||||||||||||||||||||||||||||||||||||||||||||||||||||||||||||||||||||||||||||||||||||||||
| Gallup | ||||||||||||||||||||||||||||||||||||||||||||||||||||||||||||||||||||||||||||||||||||||||||||||||||||
Do you think the government should -- or should not -- make cash payments to black Americans who are descendants of slaves?
| Should | Should not | No opinion | |
|---|---|---|---|
| % | % | % | |
| National adults | |||
| 2019 Jun 19-Jul 12 | 29 | 67 | 4 |
| 2002 Jan 25-27 | 14 | 81 | 5 |
| White adults | |||
| 2019 Jun 19-Jul 12 | 16 | 81 | 3 |
| 2002 Jan 25-27 | 6 | 90 | 4 |
| Black adults | |||
| 2019 Jun 19-Jul 12 | 73 | 25 | 2 |
| 2002 Jan 25-Feb 10 | 55 | 37 | 8 |
| Gallup | |||
Overall, how satisfied are you with your life -- are you very satisfied, somewhat satisfied, somewhat dissatisfied or very dissatisfied?
| Very satisfied | Somewhat satisfied | Somewhat dissatisfied | Very dissatisfied | No opinion | |
|---|---|---|---|---|---|
| % | % | % | % | % | |
| National adults | |||||
| 2016 Jun 7-Jul 1 | 46 | 42 | 8 | 3 | 1 |
| 2015 Jun 15-Jul 10 | 46 | 41 | 10 | 3 | * |
| 2013 Jun 13-Jul 5 | 44 | 44 | 8 | 3 | 1 |
| 2008 Jun 5-Jul 6 | 46 | 40 | 9 | 5 | * |
| 2007 Jun 4-24 | 57 | 34 | 6 | 3 | 1 |
| 2006 Jun 8-25 | 59 | 31 | 6 | 4 | * |
| 2005 Jun 6-25 | 50 | 38 | 8 | 4 | * |
| 2004 Jun 9-30 | 58 | 32 | 6 | 3 | 1 |
| 2003 Jun 12-18 | 51 | 39 | 7 | 3 | * |
| 2002 Jun 3-9 | 51 | 39 | 6 | 3 | 1 |
| 2001 Jun 11-17 | 53 | 38 | 6 | 2 | 1 |
| White adults | |||||
| 2016 Jun 7-Jul 1 | 47 | 42 | 8 | 2 | * |
| 2015 Jun 15-Jul 10 | 47 | 40 | 9 | 3 | * |
| 2013 Jun 13-Jul 5 | 45 | 44 | 8 | 3 | * |
| 2008 Jun 5-Jul 6 | 50 | 38 | 8 | 3 | * |
| 2007 Jun 4-24 | 61 | 32 | 3 | 2 | 1 |
| 2006 Jun 8-25 | 65 | 26 | 4 | 4 | * |
| 2005 Jun 6-25 | 51 | 37 | 8 | 4 | * |
| 2004 Jun 9-30 | 62 | 30 | 6 | 2 | * |
| 2003 Jun 12-15 | 55 | 37 | 6 | 2 | * |
| 2002 Jun 3-6 | 55 | 37 | 5 | 2 | 1 |
| 2001 Jun 11-17 | 54 | 38 | 5 | 3 | * |
| Black adults | |||||
| 2016 Jun 7-Jul 1 | 44 | 44 | 8 | 3 | 1 |
| 2015 Jun 15-Jul 10 | 45 | 43 | 8 | 4 | * |
| 2013 Jun 13-Jul 5 | 42 | 45 | 9 | 2 | 1 |
| 2008 Jun 5-Jul 6 | 38 | 42 | 14 | 6 | 1 |
| 2007 Jun 4-24 | 37 | 45 | 9 | 7 | 2 |
| 2006 Jun 8-25 | 41 | 45 | 10 | 4 | * |
| 2005 Jun 6-25 | 44 | 39 | 12 | 4 | 1 |
| 2004 Jun 9-30 | 44 | 38 | 10 | 6 | 2 |
| 2003 Jun 12-18 | 37 | 45 | 12 | 5 | 1 |
| 2002 Jun 3-9 | 39 | 45 | 11 | 4 | 1 |
| 2001 Jun 11-17 | 42 | 45 | 11 | 1 | 1 |
| Hispanic adults | |||||
| 2016 Jun 7-Jul 1 | 43 | 42 | 9 | 3 | 3 |
| 2015 Jun 15-Jul 10 | 38 | 42 | 13 | 6 | 1 |
| 2013 Jun 13-Jul 5 | 43 | 44 | 10 | 2 | 1 |
| 2008 Jun 5-Jul 6 | 42 | 39 | 11 | 8 | 1 |
| 2007 Jun 4-24 | 50 | 39 | 7 | 3 | 2 |
| 2006 Jun 8-25 | 53 | 36 | 7 | 2 | 2 |
| 2005 Jun 6-25 | 48 | 40 | 6 | 4 | 2 |
| 2004 Jun 9-30 | 52 | 34 | 8 | 3 | 3 |
| 2003 Jun 12-18 | 42 | 43 | 11 | 3 | 1 |
| 2002 Jun 3-9 | 46 | 44 | 6 | 2 | 2 |
| 2001 Jun 11-17 | 49 | 39 | 9 | 3 | * |
| * Less than 0.5% | |||||
| Gallup | |||||
How much of a role, if any, do you think the government should have in trying to improve the social and economic position of Blacks and other minority groups in this country -- a major role, a minor role or no role at all?
| Major role | Minor role | No role | No opinion | |
|---|---|---|---|---|
| % | % | % | % | |
| National adults | ||||
| 2016 Jun 7-Jul 1 | 38 | 40 | 22 | * |
| 2013 Jun 13-Jul 5 | 32 | 44 | 23 | 1 |
| 2011 Aug 4-7 | 27 | 46 | 26 | 1 |
| 2005 Jun 6-25 | 37 | 44 | 17 | 2 |
| 2004 Jun 9-30 | 40 | 45 | 14 | 1 |
| White adults | ||||
| 2016 Jun 7-Jul 1 | 28 | 46 | 25 | * |
| 2013 Jun 13-Jul 5 | 22 | 49 | 29 | * |
| 2011 Aug 4-7 | 19 | 50 | 30 | 1 |
| 2005 Jun 6-25 | 26 | 52 | 21 | 1 |
| 2004 Jun 9-30 | 32 | 51 | 16 | 1 |
| Black adults | ||||
| 2016 Jun 7-Jul 1 | 64 | 29 | 7 | * |
| 2013 Jun 13-Jul 5 | 54 | 36 | 10 | 1 |
| 2011 Aug 4-7 | 59 | 32 | 8 | 1 |
| 2005 Jun 6-25 | 71 | 21 | 6 | 2 |
| 2004 Jun 9-30 | 68 | 22 | 9 | 1 |
| Hispanic adults | ||||
| 2016 Jun 7-Jul 1 | 63 | 19 | 16 | 2 |
| 2013 Jun 13-Jul 5 | 60 | 28 | 10 | 1 |
| 2005 Jun 6-25 | 64 | 20 | 11 | 5 |
| 2004 Jun 9-30 | 67 | 21 | 8 | 4 |
| * Less than 0.5% | ||||
| Gallup | ||||
Which comes closer to your view about evaluating students for admission into a college or university -- [ROTATED: applicants should be admitted solely on the basis of merit, even if that results in few minority students being admitted (or) an applicant's racial and ethnic background should be considered to help promote diversity on college campuses, even if that means admitting some minority students who otherwise would not be admitted]?
| Solely on merit | Consider racial/ethnic background | No opinion | |
|---|---|---|---|
| % | % | % | |
| National adults | |||
| 2016 Jun 7-Jul 1 | 70 | 26 | 4 |
| 2013 Jun 13-Jul 5 | 67 | 28 | 5 |
| 2007 Jun 4-24 | 70 | 23 | 6 |
| 2003 Jun 12-18 | 69 | 27 | 4 |
| White adults | |||
| 2016 Jun 7-Jul 1 | 76 | 22 | 2 |
| 2013 Jun 13-Jul 5 | 75 | 22 | 3 |
| 2007 Jun 4-24 | 78 | 17 | 5 |
| 2003 Jun 12-15 | 75 | 22 | 3 |
| Black adults | |||
| 2016 Jun 7-Jul 1 | 50 | 44 | 6 |
| 2013 Jun 13-Jul 5 | 44 | 48 | 8 |
| 2007 Jun 4-24 | 47 | 46 | 8 |
| 2003 Jun 12-18 | 44 | 49 | 7 |
| Hispanic adults | |||
| 2016 Jun 7-Jul 1 | 61 | 29 | 10 |
| 2013 Jun 13-Jul 5 | 59 | 31 | 10 |
| 2007 Jun 4-24 | 58 | 35 | 7 |
| 2003 Jun 12-18 | 59 | 36 | 5 |
| Gallup | |||
If two equally qualified students, one White and one Black, applied to a major U.S. college or university, who do you think would have the better chance of being accepted to the college -- [ROTATED: the White student, the Black student] -- or would they have the same chance?
| White student | Black student | Same chance | No opinion | |
|---|---|---|---|---|
| % | % | % | % | |
| National adults | ||||
| 2016 Jun 7-Jul 1 | 30 | 22 | 46 | 2 |
| 2007 Jun 4-24 | 29 | 22 | 43 | 6 |
| 2005 Jun 6-25 | 29 | 20 | 47 | 4 |
| 2003 Jun 12-18 | 31 | 29 | 36 | 4 |
| White adults | ||||
| 2016 Jun 7-Jul 1 | 23 | 27 | 47 | 3 |
| 2007 Jun 4-24 | 20 | 26 | 48 | 6 |
| 2005 Jun 6-25 | 21 | 24 | 50 | 5 |
| 2003 Jun 12-15 | 24 | 34 | 38 | 4 |
| Black adults | ||||
| 2016 Jun 7-Jul 1 | 60 | 5 | 34 | 1 |
| 2007 Jun 4-24 | 61 | 5 | 28 | 6 |
| 2005 Jun 6-25 | 64 | 4 | 29 | 3 |
| 2003 Jun 12-18 | 67 | 5 | 24 | 4 |
| Hispanic adults | ||||
| 2016 Jun 7-Jul 1 | 40 | 11 | 49 | 1 |
| 2007 Jun 4-24 | 47 | 9 | 42 | 2 |
| 2005 Jun 6-25 | 46 | 9 | 41 | 4 |
| 2003 Jun 12-18 | 44 | 14 | 38 | 4 |
| Gallup | ||||
Do you think racism against Whites is or is not widespread in the U.S.?
| Yes, widespread | No, not | No opinion | |
|---|---|---|---|
| % | % | % | |
| National adults | |||
| 2016 Jun 7-Jul 1 | 41 | 57 | 2 |
| 2015 Jun 15-Jul 10 | 33 | 66 | 1 |
| 2009 Oct 16-19 | 44 | 53 | 4 |
| 2008 Jun 5-Jul 6 | 41 | 55 | 3 |
| White adults | |||
| 2016 Jun 7-Jul 1 | 43 | 55 | 1 |
| 2015 Jun 15-Jul 10 | 32 | 66 | 1 |
| 2009 Oct 16-19 | 46 | 50 | 4 |
| 2008 Jun 5-Jul 6 | 42 | 55 | 4 |
| Black adults | |||
| 2016 Jun 7-Jul 1 | 33 | 64 | 2 |
| 2015 Jun 15-Jul 10 | 32 | 67 | 1 |
| 2009 Oct 16-19 | 39 | 59 | 3 |
| 2008 Jun 5-Jul 6 | 36 | 62 | 2 |
| Hispanic adults | |||
| 2016 Jun 7-Jul 1 | 42 | 57 | 1 |
| 2015 Jun 15-Jul 10 | 38 | 62 | * |
| 2008 Jun 5-Jul 6 | 36 | 60 | 3 |
| * Less than 0.5% | |||
| Gallup | |||
How would you say local police in your area treat racial minorities including Blacks -- [ROTATED: very fairly, fairly, unfairly (or) very unfairly]?
| Very fairly | Fairly | Unfairly | Very unfairly | No opinion | |
|---|---|---|---|---|---|
| % | % | % | % | % | |
| National adults | |||||
| 2016 Jun 7-Jul 1 | 21 | 50 | 19 | 7 | 3 |
| 2015 Jun 15-Jul 10 | 23 | 50 | 20 | 5 | 3 |
| White adults | |||||
| 2016 Jun 7-Jul 1 | 25 | 52 | 16 | 4 | 3 |
| 2015 Jun 15-Jul 10 | 29 | 49 | 16 | 3 | 3 |
| Black adults | |||||
| 2016 Jun 7-Jul 1 | 9 | 41 | 29 | 19 | 1 |
| 2015 Jun 15-Jul 10 | 8 | 44 | 33 | 15 | * |
| Hispanic adults | |||||
| 2016 Jun 7-Jul 1 | 13 | 52 | 22 | 12 | 2 |
| 2015 Jun 15-Jul 10 | 15 | 56 | 23 | 6 | 1 |
| * Less than 0.5% | |||||
| Gallup | |||||
Do you think the American justice system is biased against Black people?
| Yes, is biased | No, is not | No opinion | |
|---|---|---|---|
| % | % | % | |
| National adults | |||
| 2016 Jun 7-Jul 1 | 49 | 49 | 2 |
| 2015 Jun 15-Jul 10 | 47 | 52 | 1 |
| 2013 Jul 16-21 | 33 | 61 | 6 |
| 2008 Jun 5-Jul 6 | 38 | 59 | 3 |
| 1993 Apr 17-18 | 37 | 56 | 7 |
| White adults | |||
| 2016 Jun 7-Jul 1 | 45 | 53 | 2 |
| 2015 Jun 15-Jul 10 | 42 | 57 | 1 |
| 2013 Jul 16-21 | 25 | 69 | 5 |
| 2008 Jun 5-Jul 6 | 32 | 66 | 2 |
| 1993 Apr 17-18 | 33 | 60 | 7 |
| Black adults | |||
| 2016 Jun 7-Jul 1 | 76 | 21 | 2 |
| 2015 Jun 15-Jul 10 | 74 | 26 | 1 |
| 2013 Jul 16-21 | 68 | 26 | 6 |
| 2008 Jun 5-Jul 6 | 67 | 27 | 6 |
| 1993 Apr 17-18 | 68 | 21 | 11 |
| Hispanic adults | |||
| 2016 Jun 7-Jul 1 | 44 | 53 | 3 |
| 2015 Jun 15-Jul 10 | 45 | 54 | 1 |
| 2013 Jul 16-21 | 40 | 52 | 8 |
| 2008 Jun 5-Jul 6 | 42 | 51 | 7 |
| * Less than 0.5% | |||
| Gallup | |||
How do you view Barack Obama's presidency in terms of progress for Black people in the United States -- as the most important advance for Black people in the past 100 years; as one of the two or three most important advances for Black people in the past 100 years, but not the most important; important, but not among the most important advances; or not that important?
| Most important | One of the most important | Important | Not that important | No opinion | |
|---|---|---|---|---|---|
| % | % | % | % | % | |
| National adults | |||||
| 2016 Jun 7-Jul 1 | 10 | 22 | 32 | 33 | 3 |
| 2011 Aug 4-7 ^ | 15 | 27 | 30 | 26 | 3 |
| 2009 Oct 16-19 ^ | 20 | 38 | 24 | 16 | 2 |
| 2008 Nov 5 ^# | 33 | 38 | 15 | 10 | 4 |
| White adults | |||||
| 2016 Jun 7-Jul 1 | 6 | 21 | 33 | 38 | 3 |
| 2011 Aug 4-7 ^ | 10 | 27 | 32 | 29 | 2 |
| 2009 Oct 16-19 ^ | 16 | 40 | 25 | 17 | 2 |
| Black adults | |||||
| 2016 Jun 7-Jul 1 | 21 | 30 | 28 | 18 | 3 |
| 2011 Aug 4-7 ^ | 34 | 31 | 23 | 9 | 3 |
| 2009 Oct 16-19 ^ | 44 | 27 | 19 | 6 | 4 |
| Hispanic adults | |||||
| 2016 Jun 7-Jul 1 | 16 | 26 | 27 | 26 | 5 |
| ^ WORDING: "How do you view Barack Obama's election as president…"; # Asked on Gallup Daily tracking survey | |||||
| Gallup | |||||
As a result of Barack Obama's presidency, do you think race relations in this country have -- [ROTATED: gotten a lot better, gotten a little better, not changed, gotten a little worse (or) gotten a lot worse]?
| A lot better | A little better | Not changed | A little worse | A lot worse | No opinion | |
|---|---|---|---|---|---|---|
| % | % | % | % | % | % | |
| National adults | ||||||
| 2016 Jun 7-Jul 1 | 5 | 24 | 24 | 23 | 23 | 1 |
| 2011 Aug 4-7 ^ | 7 | 28 | 41 | 16 | 7 | 1 |
| 2009 Oct 16-19 ^ | 7 | 34 | 35 | 16 | 6 | 1 |
| White adults | ||||||
| 2016 Jun 7-Jul 1 | 2 | 21 | 25 | 24 | 27 | 1 |
| 2011 Aug 4-7 ^ | 6 | 25 | 45 | 16 | 6 | 1 |
| 2009 Oct 16-19 ^ | 7 | 32 | 36 | 17 | 6 | 2 |
| Black adults | ||||||
| 2016 Jun 7-Jul 1 | 7 | 30 | 24 | 26 | 13 | 1 |
| 2011 Aug 4-7 ^ | 14 | 34 | 27 | 16 | 8 | 1 |
| 2009 Oct 16-19 ^ | 11 | 42 | 27 | 13 | 7 | * |
| Hispanic adults | ||||||
| 2016 Jun 7-Jul 1 | 14 | 37 | 20 | 13 | 14 | 1 |
| * Less than 0.5%; ^ WORDING: "As a result of Barack Obama's election,.." | ||||||
| Gallup | ||||||
Next we have a question about a president's policies to help improve the standard of living of Blacks in the United States. Do you think the policies of Barack Obama have gone too far, have been about right or have not gone far enough in promoting efforts to aid the Black community?
| Too far | About right | Not far enough | No opinion | |
|---|---|---|---|---|
| % | % | % | % | |
| National adults | ||||
| 2016 Jun 7-Jul 1 | 21 | 40 | 33 | 6 |
| 2011 Aug 4-7 ^ | 25 | 43 | 23 | 10 |
| 2009 Oct 16-19 ^ | 24 | 47 | 18 | 11 |
| 2008 Nov 7-9 ^ | 24 | 64 | 8 | 4 |
| 2008 May 30-Jun 1 ^ | 26 | 47 | 9 | 18 |
| White adults | ||||
| 2016 Jun 7-Jul 1 | 25 | 39 | 30 | 6 |
| 2011 Aug 4-7 ^ | 29 | 42 | 18 | 12 |
| 2009 Oct 16-19 ^ | 28 | 45 | 16 | 11 |
| 2008 May 30-Jun 1 ^ | 27 | 46 | 7 | 20 |
| Black adults | ||||
| 2016 Jun 7-Jul 1 | 6 | 39 | 52 | 2 |
| 2011 Aug 4-7 ^ | 5 | 47 | 43 | 5 |
| 2009 Oct 16-19 ^ | 5 | 55 | 32 | 8 |
| 2008 May 30-Jun 2 ^ | 5 | 64 | 20 | 11 |
| Hispanic adults | ||||
| 2016 Jun 7-Jul 1 | 15 | 48 | 33 | 4 |
| ^ WORDING: Next we have a question about a president's policies to help improve the standard of living of Blacks in the United States. Do you think the policies of Barack Obama will go too far, will be about right or will not go far enough in promoting efforts to aid the Black community? | ||||
| Gallup | ||||
Just your opinion, what do you think is the single most important thing that could be done to reduce the number of deadly encounters between Black men and police in the U.S.?
| 2016 Jul 13-17 | |
|---|---|
| % | |
| Better relations/communication/understanding | 19 |
| Better/additional police training | 9 |
| Change Blacks' attitudes toward police/More respect/Cooperation | 8 |
| Accountability/Responsibility for own actions/Obey the law | 6 |
| Gun control/Get rid of guns/Disband NRA | 5 |
| Less focus on race/Less racism | 5 |
| Police should be more patient/Slower to act/ Use common sense/Less brutality | 5 |
| Education (non-specific) | 5 |
| Better/more accurate reporting/Media, politicians not blow issue out of proportion | 4 |
| More/better jobs for Blacks | 2 |
| Better hiring practices/hire more qualified police/more diverse police | 2 |
| Find religion/Jesus/ethics | 2 |
| More responsibility/better parenting among blacks/Teach respect | 1 |
| Eliminate stereotyping of Blacks | 1 |
| Improve police policies and procedures | 1 |
| Reform law enforcement/criminal justice system | 1 |
| Better leadership/President Obama | 1 |
| Educate on issues/Raise awareness/What to do if pulled over | 1 |
| More technology/cameras | 1 |
| Better education of underprivileged/Blacks | 1 |
| Police need to be more strict/do their job | 1 |
| Eliminate Black Lives Matter movement | 1 |
| Need more police | 1 |
| Better drug enforcement | 1 |
| Other | 2 |
| Nothing | 4 |
| No opinion | 11 |
| Gallup | |
Now thinking ahead, 10 years from now, do you think civil rights for Black people will be -- [ROTATED: greatly improved, somewhat improved, the same, somewhat worse (or) much worse]?
| Greatly improved | Somewhat improved | Stayed the same | Somewhat worsened | Greatly worsened | No opinion | |
|---|---|---|---|---|---|---|
| % | % | % | % | % | % | |
| National adults | ||||||
| 2015 Jun 15-Jul 10 | 19 | 48 | 27 | 4 | 2 | 1 |
| 2008 Jun 5-Jul 6 | 28 | 45 | 21 | 2 | 1 | 3 |
| White adults | ||||||
| 2015 Jun 15-Jul 10 | 18 | 49 | 27 | 3 | 1 | 2 |
| 2008 Jun 5-Jul 6 | 28 | 48 | 21 | 1 | * | 2 |
| Black adults | ||||||
| 2015 Jun 15-Jul 10 | 15 | 40 | 29 | 9 | 7 | 1 |
| 2008 Jun 5-Jul 6 | 24 | 41 | 23 | 9 | 1 | 2 |
| Hispanic adults | ||||||
| 2015 Jun 15-Jul 10 | 22 | 48 | 22 | 3 | 3 | 2 |
| 2008 Jun 5-Jul 6 | 29 | 41 | 19 | 2 | 4 | 5 |
| * Less than 0.5% | ||||||
| Gallup | ||||||
Which would you prefer to see in your local area -- [ROTATED: a larger police presence than currently exists, no change (or) a smaller police presence than currently exists]?
| Larger | No change | Smaller | No opinion | |
|---|---|---|---|---|
| % | % | % | % | |
| National adults | ||||
| 2015 Jun 15-Jul 10 | 23 | 68 | 9 | 1 |
| White adults | ||||
| 2015 Jun 15-Jul 10 | 18 | 74 | 8 | 1 |
| Black adults | ||||
| 2015 Jun 15-Jul 10 | 38 | 51 | 10 | 1 |
| Hispanic adults | ||||
| 2015 Jun 15-Jul 10 | 30 | 59 | 10 | 1 |
| * Less than 0.5% | ||||
| Gallup | ||||
As you may know, a jury recently found George Zimmerman not guilty of second degree murder or manslaughter in the death of Trayvon Martin. From what you know about the case, do you think the verdict was right or wrong?
| Right | Wrong | No opinion | |
|---|---|---|---|
| % | % | % | |
| National adults | |||
| 2013 Jul 16-21 | 43 | 40 | 17 |
| White adults | |||
| 2013 Jul 16-21 | 54 | 30 | 17 |
| Black adults | |||
| 2013 Jul 16-21 | 7 | 85 | 8 |
| Hispanic adults | |||
| 2013 Jul 16-21 | 25 | 51 | 24 |
| Gallup | |||
On average, Blacks have worse jobs, income and housing than Whites. Do you think this is mostly due to discrimination against Blacks, or is it mostly due to something else?
| Mostly discrimination | Mostly something else | No opinion | |
|---|---|---|---|
| % | % | % | |
| National adults | |||
| 2013 Jun 13-Jul 5 | 20 | 77 | 2 |
| 2003 Jun 12-18 | 19 | 77 | 4 |
| 1993 Aug 23-25 | 24 | 70 | 6 |
| White adults | |||
| 2013 Jun 13-Jul 5 | 15 | 83 | 2 |
| 2003 Jun 12-15 | 16 | 81 | 3 |
| 1993 Aug 23-25 | 21 | 73 | 6 |
| Black adults | |||
| 2013 Jun 13-Jul 5 | 37 | 60 | 3 |
| 2003 Jun 12-18 | 40 | 53 | 7 |
| 1993 Aug 23-25 | 44 | 48 | 7 |
| Hispanic adults | |||
| 2013 Jun 13-Jul 5 | 27 | 70 | 3 |
| 2003 Jun 12-18 | 22 | 72 | 6 |
| Gallup | |||
On average, Black males are more likely to go to prison than White males. Do you think this is mostly due to discrimination against Blacks, or is it mostly due to something else?
| Mostly discrimination | Mostly something else | No opinion | |
|---|---|---|---|
| % | % | % | |
| National adults | |||
| 2013 Jun 13-Jul 5 | 25 | 74 | 2 |
| White adults | |||
| 2013 Jun 13-Jul 5 | 19 | 80 | 1 |
| Black adults | |||
| 2013 Jun 13-Jul 5 | 50 | 48 | 2 |
| Hispanic adults | |||
| 2013 Jun 13-Jul 5 | 24 | 73 | 3 |
| Gallup | |||
Some people say the term "African American" should be used instead of the word "Black." Which term do you prefer -- "African American" or "Black," or does it not matter to you either way?
Among Black adults
| Prefer "African American" | Prefer "Black" | Does not matter | No opinion | |
|---|---|---|---|---|
| % | % | % | % | |
| 2013 Jun 13-Jul 5 | 17 | 17 | 65 | 1 |
| 2007 Jun 4-24 | 24 | 13 | 61 | 1 |
| 2003 Jun 12-18 | 23 | 15 | 59 | 3 |
| 2000 Dec 15-18 | 19 | 13 | 66 | 2 |
| 1994 Aug 23-24 ^ | 18 | 17 | 60 | 5 |
| 1994 Apr 22-24 ^ | 21 | 13 | 64 | 3 |
| 1992 May 7-10 ^ | 23 | 22 | 56 | -- |
| 1991 Jun 13-16 ^ | 18 | 19 | 61 | 2 |
| ^ WORDING: "Some people say the term "African American" should be used instead of the word "Black." Which term do you prefer -- "African American" or "Black," or does it not matter to you?" | ||||
| Gallup | ||||
Some people say the term "Latino" should be used instead of the word "Hispanic." Which term do you prefer -- "Latino" or "Hispanic," or does it not matter to you either way?
Among Hispanic adults
| Prefer "Latino" | Prefer "Hispanic" | Does not matter | No opinion | ||||||||||||||||||||||||||||||||||||||||||||||||||||||||||||||||||||||||||||||||||||||||||||||||
|---|---|---|---|---|---|---|---|---|---|---|---|---|---|---|---|---|---|---|---|---|---|---|---|---|---|---|---|---|---|---|---|---|---|---|---|---|---|---|---|---|---|---|---|---|---|---|---|---|---|---|---|---|---|---|---|---|---|---|---|---|---|---|---|---|---|---|---|---|---|---|---|---|---|---|---|---|---|---|---|---|---|---|---|---|---|---|---|---|---|---|---|---|---|---|---|---|---|---|---|
| % | % | % | % | ||||||||||||||||||||||||||||||||||||||||||||||||||||||||||||||||||||||||||||||||||||||||||||||||
| 2013 Jun 13-Jul 5 | 10 | 19 | 70 | * | |||||||||||||||||||||||||||||||||||||||||||||||||||||||||||||||||||||||||||||||||||||||||||||||
| * Less than 0.5% | |||||||||||||||||||||||||||||||||||||||||||||||||||||||||||||||||||||||||||||||||||||||||||||||||||
| Gallup | |||||||||||||||||||||||||||||||||||||||||||||||||||||||||||||||||||||||||||||||||||||||||||||||||||
As you may know, some U.S. leaders have called for an open national dialogue on race. If Blacks and Whites honestly expressed their true feelings about race relations, do you think this would do more to -- [ROTATED: bring the races together (or) cause greater racial division]?
| Bring races together | Cause greater division | No opinion | |
|---|---|---|---|
| % | % | % | |
| National adults | |||
| 2009 Oct 16-19 | 56 | 37 | 7 |
| 2008 Jun 5-Jul 6 | 59 | 34 | 7 |
| White adults | |||
| 2009 Oct 16-19 | 53 | 39 | 8 |
| 2008 Jun 5-Jul 6 | 57 | 35 | 8 |
| Black adults | |||
| 2009 Oct 16-19 | 70 | 26 | 4 |
| 2008 Jun 5-Jul 6 | 69 | 27 | 4 |
| Hispanic adults | |||
| 2008 Jun 5-Jul 6 | 64 | 29 | 7 |
| Gallup | |||
In your view, should government programs that are designed to address economic inequality give special consideration to Blacks because of past racial discrimination, or should these programs only take into account a person's economic situation?
| Yes, give special consideration | Only consider economic situation | No opinion | |
|---|---|---|---|
| % | % | % | |
| National adults | |||
| 2008 Jun 5-Jul 6 | 9 | 87 | 4 |
| White adults | |||
| 2008 Jun 5-Jul 6 | 7 | 90 | 3 |
| Black adults | |||
| 2008 Jun 5-Jul 6 | 18 | 78 | 4 |
| Hispanic adults | |||
| 2008 Jun 5-Jul 6 | 15 | 79 | 6 |
| Gallup | |||
How much confidence do you have in the local police in your area to treat Blacks and Whites equally -- a great deal, a fair amount, not much or none at all?
| Great deal | Fair amount | Not much | None | No opinion | |
|---|---|---|---|---|---|
| % | % | % | % | % | |
| National adults | |||||
| 2008 Jun 5-Jul 6 | 37 | 36 | 17 | 8 | 2 |
| White adults | |||||
| 2008 Jun 5-Jul 6 | 42 | 39 | 14 | 4 | 2 |
| Black adults | |||||
| 2008 Jun 5-Jul 6 | 12 | 33 | 34 | 19 | 1 |
| Hispanic adults | |||||
| 2008 Jun 5-Jul 6 | 30 | 27 | 25 | 13 | 5 |
| Gallup | |||||
If you had to name one individual or leader in the U.S. to speak for you on issues of race, who would that be? [OPEN-ENDED]
Among Black adults
| 2008 Jun 5-Jul 6 | |
|---|---|
| % | |
| Barack Obama | 29 |
| Al Sharpton | 6 |
| Jesse Jackson | 4 |
| Bill Clinton | 3 |
| Hillary Clinton | 3 |
| Oprah Winfrey | 2 |
| Maya Angelou | 1 |
| Colin Powell | 1 |
| Louis Farrakhan | 1 |
| Bill Cosby | 1 |
| Tavis Smiley | 1 |
| Cornel West | 1 |
| My minister/pastor | 1 |
| Me/Myself | 6 |
| Other | 18 |
| No one (vol.) | 7 |
| No opinion | 16 |
| Gallup | |
Everything else being equal, if you had been born White, do you think you would be -- [ROTATED: better off, the same (or) worse off] than you are now?
Among Black adults
| Better off | The same | Worse off | No opinion | |
|---|---|---|---|---|
| % | % | % | % | |
| Black adults | ||||
| 2008 Jun 5-Jul 6 | 48 | 41 | 5 | 5 |
| Gallup | ||||
Everything else being equal, if you had been born Black, do you think you would be -- [ROTATED: better off, the same (or) worse off] than you are now?
Among White adults
| Better off | The same | Worse off | No opinion | |
|---|---|---|---|---|
| % | % | % | % | |
| White adults | ||||
| 2008 Jun 5-Jul 6 | 6 | 60 | 31 | 3 |
| Gallup | ||||
How often do you worry that your total family income will not be enough to meet your family's expenses and bills -- all of the time, most of the time, some of the time or almost never?
| All of the time | Most of the time | Some of the time | Almost never | No opinion | |
|---|---|---|---|---|---|
| % | % | % | % | % | |
| National adults | |||||
| 2007 Jun 4-24 | 21 | 13 | 37 | 28 | 1 |
| 2006 Jun 8-25 | 20 | 12 | 35 | 32 | * |
| 2005 Jun 6-25 | 18 | 11 | 43 | 28 | * |
| 2004 Jun 9-30 | 15 | 10 | 36 | 38 | 1 |
| 2002 Dec 9-2003 Feb 11 | 12 | 14 | 37 | 36 | 1 |
| 1998 Apr 23-May 31 | 9 | 12 | 44 | 34 | 1 |
| 1989 Jun 15-18 | 13 | 13 | 35 | 38 | 1 |
| 1987 Jan 16-19 | 15 | 16 | 38 | 30 | 1 |
| 1984 Jan 27-30 | 20 | 15 | 30 | 34 | 1 |
| 1976 Jan 1-Jun 1 | 13 | 13 | 36 | 38 | -- |
| Non-Hispanic White adults | |||||
| 2007 Jun 4-24 | 18 | 12 | 39 | 31 | * |
| 2006 Jun 8-25 | 18 | 9 | 36 | 36 | 1 |
| 2005 Jun 6-25 | 16 | 10 | 44 | 30 | * |
| 2004 Jun 9-30 | 12 | 9 | 37 | 42 | * |
| Long-term trend: White adults (including Hispanic adults) | |||||
| 2007 Jun 4-24 | 19 | 13 | 39 | 29 | * |
| 2006 Jun 8-25 | 19 | 12 | 35 | 34 | 1 |
| 2005 Jun 6-25 | 16 | 11 | 44 | 29 | * |
| 2004 Jun 9-30 | 13 | 9 | 37 | 41 | * |
| 2002 Dec 9-2003 Feb 11 | 10 | 15 | 36 | 38 | 1 |
| 1998 Apr 23-May 31 | 9 | 11 | 45 | 35 | * |
| 1989 Jun 15-18 | 12 | 12 | 35 | 40 | 1 |
| 1984 Jan 27-30 | 18 | 15 | 31 | 36 | * |
| Black adults | |||||
| 2007 Jun 4-24 | 33 | 15 | 27 | 24 | 1 |
| 2006 Jun 8-25 | 26 | 16 | 36 | 22 | * |
| 2005 Jun 6-25 | 26 | 17 | 36 | 20 | 1 |
| 2004 Jun 9-30 | 25 | 14 | 33 | 26 | 2 |
| 2002 Dec 9-2003 Feb 11 | 19 | 18 | 35 | 26 | 2 |
| 1998 Apr 23-May 31 | 15 | 16 | 42 | 27 | * |
| 1989 Jun 15-18 | 22 | 20 | 31 | 25 | 2 |
| 1984 Jan 27-30 | 38 | 21 | 24 | 15 | 2 |
| Hispanic adults | |||||
| 2007 Jun 4-24 | 27 | 18 | 33 | 20 | 1 |
| 2006 Jun 8-25 | 16 | 22 | 37 | 25 | 1 |
| 2005 Jun 6-25 | 27 | 14 | 38 | 20 | 1 |
| 2004 Jun 9-30 | 24 | 15 | 34 | 27 | * |
| * Less than 0.5% | |||||
| Gallup | |||||
Have there been times during the last year when you did not have enough money to buy food your family needed?
| Yes | No | No opinion | |
|---|---|---|---|
| % | % | % | |
| National adults | |||
| 2007 Jun 4-24 | 18 | 82 | * |
| 2005 Jun 6-25 | 16 | 84 | * |
| 2004 Jun 9-30 | 17 | 83 | * |
| 2002 Dec 9-2003 Feb 11 | 13 | 86 | 1 |
| 1998 Apr 23-May 31 | 11 | 89 | -- |
| 1989 Jun 15-18 | 13 | 87 | -- |
| 1987 Jan 16-19 | 16 | 84 | -- |
| 1984 Jan 27-30 | 20 | 79 | 1 |
| 1976 Jan 1-Jun 1 | 14 | 86 | -- |
| Non-Hispanic White adults | |||
| 2007 Jun 4-24 | 10 | 90 | * |
| 2005 Jun 6-25 | 11 | 89 | -- |
| 2004 Jun 9-30 | 12 | 88 | * |
| Long-term trend: White adults (including Hispanic adults) | |||
| 2007 Jun 4-24 | 14 | 86 | * |
| 2005 Jun 6-25 | 13 | 87 | * |
| 2004 Jun 9-30 | 14 | 86 | * |
| 2002 Dec 9-2003 Feb 11 | 11 | 88 | 1 |
| 1998 Apr 23-May 31 | 9 | 91 | -- |
| 1989 Jun 15-18 | 10 | 89 | 1 |
| 1987 Jan 16-19 | 14 | 86 | -- |
| 1984 Jan 27-30 | 17 | 82 | 1 |
| Black adults | |||
| 2007 Jun 4-24 | 36 | 64 | * |
| 2005 Jun 6-25 | 31 | 69 | * |
| 2004 Jun 9-30 | 31 | 67 | 2 |
| 2002 Dec 9-2003 Feb 11 | 28 | 72 | * |
| 1998 Apr 23-May 31 | 24 | 76 | -- |
| 1989 Jun 15-18 | 36 | 64 | -- |
| 1987 Jan 16-19 | 31 | 69 | -- |
| 1984 Jan 27-30 | 51 | 47 | 2 |
| Hispanic adults | |||
| 2007 Jun 4-24 | 39 | 61 | * |
| 2005 Jun 6-25 | 36 | 64 | * |
| 2004 Jun 9-30 | 33 | 67 | * |
| * Less than 0.5% | |||
| Gallup | |||
Have there been times during the last year when you did not have enough money to buy clothing your family needed?
| Yes | No | No opinion | |
|---|---|---|---|
| % | % | % | |
| National adults | |||
| 2007 Jun 4-24 | 21 | 79 | * |
| 2005 Jun 6-25 | 23 | 76 | 1 |
| 2004 Jun 9-30 | 20 | 79 | 1 |
| 2002 Dec 9-2003 Feb 11 | 17 | 83 | -- |
| 1998 Apr 23-May 31 | 18 | 82 | -- |
| 1989 Jun 15-18 | 17 | 83 | -- |
| 1987 Jan 16-19 | 19 | 81 | -- |
| 1984 Jan 27-30 | 26 | 73 | 1 |
| 1976 Jan 1-Jun 1 | 19 | 80 | 1 |
| Non-Hispanic White adults | |||
| 2007 Jun 4-24 | 12 | 87 | * |
| 2005 Jun 6-25 | 19 | 81 | * |
| 2004 Jun 9-30 | 15 | 84 | 1 |
| Long-term trend: White adults (including Hispanic adults) | |||
| 2007 Jun 4-24 | 17 | 83 | * |
| 2005 Jun 6-25 | 20 | 79 | 1 |
| 2004 Jun 9-30 | 17 | 82 | 1 |
| 2002 Dec 9-2003 Feb 11 | 16 | 84 | -- |
| 1998 Apr 23-May 31 | 31 | 69 | * |
| 1989 Jun 15-18 | 33 | 67 | -- |
| 1987 Jan 16-19 | 37 | 63 | -- |
| 1984 Jan 27-30 | 39 | 61 | -- |
| Black adults | |||
| 2007 Jun 4-24 | 40 | 60 | * |
| 2005 Jun 6-25 | 37 | 63 | * |
| 2004 Jun 9-30 | 36 | 62 | 2 |
| 2002 Dec 9-2003 Feb 11 | 28 | 72 | * |
| 1998 Apr 23-May 31 | 24 | 76 | -- |
| 1989 Jun 15-18 | 36 | 64 | -- |
| 1987 Jan 16-19 | 31 | 69 | -- |
| 1984 Jan 27-30 | 51 | 47 | 2 |
| Hispanic adults | |||
| 2007 Jun 4-24 | 43 | 56 | * |
| 2005 Jun 6-25 | 45 | 55 | * |
| 2004 Jun 9-30 | 37 | 63 | * |
| * Less than 0.5% | |||
| Gallup | |||
Have there been times during the last year when you did not have enough money to pay for medical or healthcare?
| Yes | No | No opinion | |
|---|---|---|---|
| % | % | % | |
| National adults | |||
| 2007 Jun 4-24 | 32 | 68 | * |
| 2005 Jun 6-25 | 28 | 71 | 1 |
| 2004 Jun 9-30 | 28 | 71 | 1 |
| 2002 Dec 9-2003 Feb 11 | 21 | 79 | * |
| 1998 Apr 23-May 31 | 22 | 78 | * |
| 1989 Jun 15-18 | 21 | 79 | -- |
| 1987 Jan 16-19 | 21 | 78 | 1 |
| 1984 Jan 27-30 | 25 | 75 | * |
| 1976 Jan 1-Jun 1 | 15 | 85 | * |
| Non-Hispanic White adults | |||
| 2007 Jun 4-24 | 26 | 74 | * |
| 2005 Jun 6-25 | 24 | 76 | * |
| 2004 Jun 9-30 | 23 | 77 | * |
| Long-term trend: White adults (including Hispanic adults) | |||
| 2007 Jun 4-24 | 30 | 70 | * |
| 2005 Jun 6-25 | 26 | 74 | * |
| 2004 Jun 9-30 | 25 | 75 | * |
| 2002 Dec 9-2003 Feb 11 | 18 | 82 | * |
| 1998 Apr 23-May 31 | 19 | 81 | * |
| 1989 Jun 15-18 | 19 | 81 | -- |
| 1987 Jan 16-19 | 19 | 80 | 1 |
| 1984 Jan 27-30 | 22 | 78 | * |
| Black adults | |||
| 2007 Jun 4-24 | 45 | 55 | 1 |
| 2005 Jun 6-25 | 42 | 58 | * |
| 2004 Jun 9-30 | 38 | 60 | 2 |
| 2002 Dec 9-2003 Feb 11 | 34 | 65 | 1 |
| 1998 Apr 23-May 31 | 39 | 61 | * |
| 1989 Jun 15-18 | 41 | 59 | -- |
| 1987 Jan 16-19 | 31 | 68 | 1 |
| 1984 Jan 27-30 | 51 | 45 | 4 |
| Hispanic adults | |||
| 2007 Jun 4-24 | 48 | 52 | * |
| 2005 Jun 6-25 | 46 | 53 | 1 |
| 2004 Jun 9-30 | 44 | 56 | * |
| * Less than 0.5% | |||
| Gallup | |||
Related Topics Include:
Education Housing Immigration Jobs Law and Order Personal Finance Race Relations Social and Policy Issues Trends A to Z WorkplaceThe Five Conditions Assessment
Discover a valuable tool for business owners, policymakers and investors to reliably assess companies' potential for growth.


