PRINCETON, NJ -- Young Americans in their 20s and 30s today share two important political characteristics -- they are the most likely of any age group to eschew identification with either party, and, among those who do have a political identity, they are the most likely, along with older baby boomers, to tilt toward the Democratic Party.
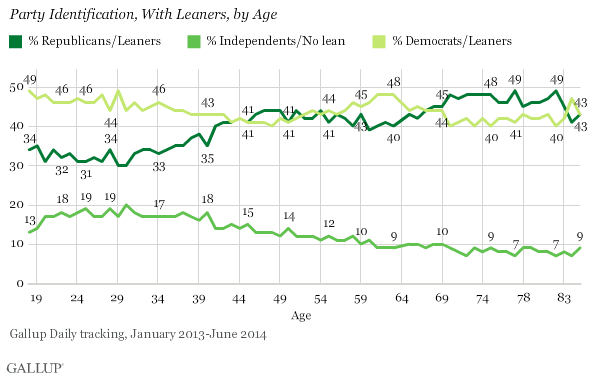
Americans aged 18 to 40 are least likely to identify with a party or even lean toward one, with almost one out of five falling into that category. At the same time, among those who do identify with or lean toward one of the two major parties, there is a double-digit Democratic advantage among those at each age point from 18 to 35. These are in fact the only ages -- across the entire age spectrum -- at which Democrats hold a 10-point or higher advantage.
These results represent both good news and bad news for Democrats. While Democrats enjoy a decided advantage in partisan identification among today's young adults, the higher percentages who don't identify with or even lean toward a party are symptomatic of young Americans' distance from the political system. This, in turn, reflects the political reality that this group is less likely than older age groups to vote. Additionally, while Democrats have a decided identification advantage among those younger than 40, it is hardly monolithic, given that more than 30% of the group identifies with or leans toward the Republican Party.
These findings are based on more than 267,000 interviews conducted as part of Gallup's Daily tracking from January 2013 through June 2014, using Gallup's standard party identification question: "In politics, as of today, do you consider yourself a Republican, a Democrat [order rotated], or an independent?" Those who initially identify as independents are subsequently asked if they lean toward either party, and the combined party preferences, including "leaners," are presented in the first graph.
A Gallup analysis from earlier this year demonstrated how different age groups have, over time, shifted in their political party preferences. The 2013-2014 data analyzed here allow for a more fine-grained analysis of current party affiliation at each individual age. A Gallup report on 2009 data by age showed broadly similar patterns, although the overall population at that point was significantly more Democratic in orientation.
There is no sign of a pending reduction in Democratic strength among even the very youngest adult Americans. Those 18 and 19 years of age, many of whom may still be living at home, are slightly more likely to identify with or lean toward one of the two major parties than those between 20 and 30 years of age. But among those 20 to 30, the Democratic tilt is fairly consistent.
As noted in previous Gallup research, Democrats also perform relatively well among baby boomers aged 60 to 63. Democrats have a seven- to eight-percentage-point average advantage among this group of Americans who were born between about 1950 and 1953, and who came of age during the late 1960s and early 1970s. The Democratic Party does slightly less well among younger baby boomers, those aged 57 to 59, while the oldest baby boomers, aged 64 to 67, are much less Democratic than other boomers in their party identification.
Republicans Do Best Among Middle-Aged and Older Americans
Republicans do best among two age segments, the first of which is Americans aged 43 to 56 -- among whom the GOP has a slight edge, breaks even, or is at only a slight disadvantage compared with Democrats. These Americans were born between 1957 and 1970, and straddle the Gen X and the baby boomer generations. The second area of relative GOP strength is among Americans 69 and older, with the exception of a Democratic tilt among 84-year-old Americans. Although not represented on the accompanying graphs because of low sample sizes, Democrats do better as a rule among the smaller segments of Americans aged 86 and up into their 90s.
The GOP edge among seniors is not as pronounced as is the Democratic edge among young Americans, and at no point across the entire age spectrum do Republicans enjoy a double-digit party identification advantage. However, seniors are the most likely to turn out and vote in elections, meaning the modest Republican advantage among older Americans translates into disproportionate power at the ballot box.
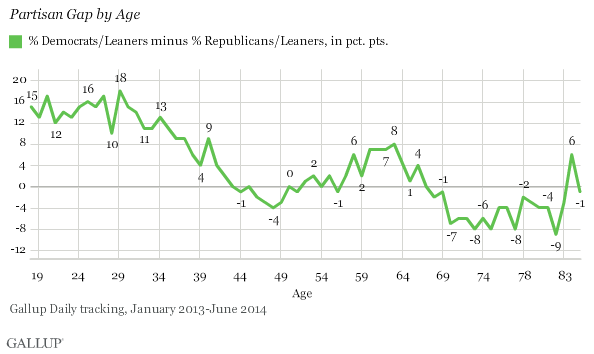
The Partisan Gap Reflects Varied Political Sensibilities
A broad portrait of the political shape of today's electorate is provided in the accompanying graph, which summarizes the party identification gap at each age point from 18 to 85. Democrats' decided youth advantage begins to erode as Americans enter their late 30s and 40s, picks up again (though to a lesser extent) among Americans in their 50s and early 60s, and then erodes further among those in their mid-60s and older.
Almost Half of Young Americans Initially Identify as Independents
The party identification results reviewed above are based on the combined percentages who identify with a party and those who initially claim to be independent but lean toward either party when probed. The results of the initial party identification question -- before independents are probed as to their leanings -- are presented in the next graph. The results provide an insight into those who can be classified as "core" Republicans (those who initially identify themselves as Republicans), "core" Democrats (those who initially identify themselves as Democrats) and those who identify themselves as independents in the initial question, even if many of these later indicate they lean to a particular party.
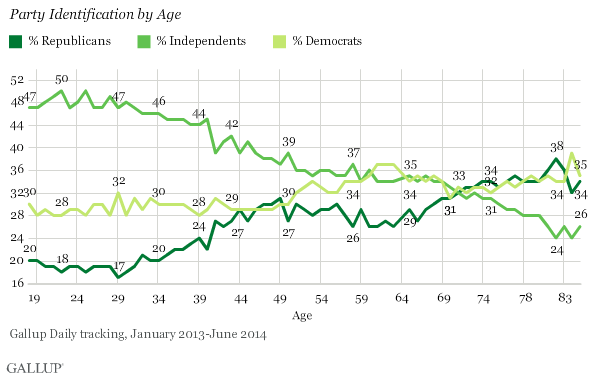
These results highlight, again, the political detachment of the younger generation, with almost half of the very youngest initially identifying themselves as independents. The percentage of Americans who are independent drops at a remarkably steady rate across the entire age spectrum.
The percentage of the population who are core Democrats and core Republicans generally reflects the patterns seen previously when leaners are taken into account. Republican identification is low among young Americans, rises somewhat among middle-aged Americans, and rises again among Americans who are 70 and older. The representation of those who identify as a core Democrat is more stable across age, reaching a slightly higher point among older baby boomers and among a smaller segment of Americans in their mid-80s.
Implications
Democrats have a general advantage in American politics today, with 44% of American adults interviewed in 2013 and the first half of 2014 identifying with or leaning toward the Democratic Party, contrasted with 39% who identify with or lean toward the Republican Party. These overall numbers, however, mask highly important differences across the age spectrum. Young Americans are more detached from the political system in general, but still tilt strongly toward the Democratic Party, particularly when those who initially identify as independents are asked to which party they lean. Middle-aged Americans from about 40 to their mid-50s are more Republican in their political leanings, while older baby boomers tilt back toward a Democratic political orientation. Finally, seniors in today's world for the most part constitute Republicans' strongest age group.
Survey Methods
Results for this Gallup poll are based on telephone interviews conducted Jan. 2, 2013-June 30, 2014, on the Gallup Daily tracking survey, with a random sample of 267,321 adults, aged 18 and older, living in all 50 U.S. states and the District of Columbia.
For results based on the total sample of national adults, the margin of sampling error is ±1 percentage point at the 95% confidence level.
The margin of sampling error for the samples of those at each age varies depending on the sample size, which varies from a high of 6,583 of those aged 65, to a low of 1,749 of those aged 85, but in all instances is no more than ±3 percentage points at the 95% confidence level.
Interviews are conducted with respondents on landline telephones and cellular phones, with interviews conducted in Spanish for respondents who are primarily Spanish-speaking. Each sample of national adults includes a minimum quota of 50% cellphone respondents and 50% landline respondents, with additional minimum quotas by time zone within region. Landline and cellular telephone numbers are selected using random-digit-dial methods. Landline respondents are chosen at random within each household on the basis of which member had the most recent birthday.
Samples are weighted to correct for unequal selection probability, nonresponse, and double coverage of landline and cell users in the two sampling frames. They are also weighted to match the national demographics of gender, age, race, Hispanic ethnicity, education, region, population density, and phone status (cellphone only/landline only/both, and cellphone mostly). Demographic weighting targets are based on the most recent Current Population Survey figures for the aged 18 and older U.S. population. Phone status targets are based on the most recent National Health Interview Survey. Population density targets are based on the most recent U.S. census. All reported margins of sampling error include the computed design effects for weighting.
In addition to sampling error, question wording and practical difficulties in conducting surveys can introduce error or bias into the findings of public opinion polls.
For more details on Gallup's polling methodology, visit www.gallup.com.