PRINCETON, NJ -- Americans' disenchantment with Congress may lead to higher voter turnout on Election Day this year. In the last five midterm elections, voter turnout has exceeded 40% when Congress' approval rating was low, but turnout was below 40% when Americans were more approving.
Congressional job approval, currently 13%, is on pace to be the lowest it has been in a midterm election year. Moreover, a near-record-low 19% of registered voters say most members of Congress deserve re-election. This latter measure shows a similarly strong relationship to voter turnout as does job approval.
 |
| Discover how Americans rate their state in 2014, across key metrics > |
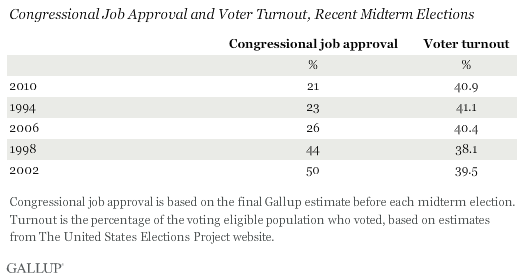
Voter turnout in midterm elections has ranged narrowly between 38.1% and 41.1% since 1994, considerably lower than the 51.7% to 61.6% range for the last five presidential elections. But there has been a clear pattern of turnout being on the higher end of the midterm year range when Americans were less approving of Congress. The correlation between turnout and congressional approval since 1994 is -.83, indicating a strong relationship.
The disapproval-turnout link is a fairly recent phenomenon. From 1974 -- the first year Gallup measured congressional job approval -- until 1990, there was only a weak relationship between turnout and approval, with turnout higher when approval was higher, the opposite of the current pattern. But that weak relationship was driven mostly by the 1974 midterm elections, when turnout was among the higher ones for midterms and Congress was relatively popular after the Watergate hearings that led to President Richard Nixon's resignation that summer.
The pre-1994 congressional landscape was characterized by Democratic Party dominance of Congress, as it enjoyed a 40-year reign as the majority party in the House of Representatives until the 1994 elections.
Voters Feeling More Empowered to Make Change in Recent Elections?
Since 1994, majority control of the House has changed hands three times in five midterm elections: after the 1994, 2006, and 2010 elections. Not coincidentally, congressional approval was low and turnout was high in those three elections, which suggests voters were motivated to change the direction of national policy, perhaps something that didn't seem likely to occur in midterm elections prior to 1994.
The 1994, 2006, and 2010 elections took place with a relatively unpopular president paired with a Congress controlled by the same party. While President Barack Obama is unpopular at the moment, averaging 42% approval in August to date, he is governing at a time when Republicans hold a majority in the House, while his fellow Democrats are the majority party in the Senate. In 2010, his job approval rating just before the elections was similar, at 45%.
As a result, it is unclear how the current frustration with Congress will manifest itself in terms of party control of the two houses of Congress. Because the president's party usually loses seats in the House in midterm elections, few give the Democrats much chance of reclaiming the majority there. The Senate appears to be the more important battleground, as Democrats, expected to lose seats, are trying to avoid losing the six seats that would give the Republicans the majority.
Implications
Since 1994, voters may have a greater belief that they can change the federal government and its policies by their choices of members of Congress in midterm elections. That belief in turn may help drive up turnout when voters feel a change is needed.
Voters likely feel a change in government is needed this year, given their historically low congressional approval ratings. Past patterns suggest this should lead to above-average turnout in the midterm elections this November. But there may be less consensus this year on what that change should be, given the divided control of Congress. In some recent elections, one party was clearly vulnerable to voters' wrath when they were upset with Congress because that party had control of the presidency and both houses.
If many voters see little possibility of changing the partisan makeup of government after this fall's elections -- given that a divided government is already in place and almost certainly will be after the elections -- there could be no increase in turnout this year despite Americans' frustration with Congress. However, if voters have designs on changing the government and see a good chance that they can do so -- perhaps by voting against incumbents of both parties -- then turnout may rise, as in similar past elections.
Survey Methods
Results for this Gallup poll are based on telephone interviews conducted Aug. 7-10, 2014, with a random sample of 1,032 adults, aged 18 and older, living in all 50 U.S. states and the District of Columbia.
For results based on the total sample of national adults, the margin of sampling error is ±4 percentage points at the 95% confidence level.
Interviews are conducted with respondents on landline telephones and cellular phones, with interviews conducted in Spanish for respondents who are primarily Spanish-speaking. Each sample of national adults includes a minimum quota of 50% cellphone respondents and 50% landline respondents, with additional minimum quotas by time zone within region. Landline and cellular telephone numbers are selected using random-digit-dial methods. Landline respondents are chosen at random within each household on the basis of which member had the most recent birthday.
Samples are weighted to correct for unequal selection probability, nonresponse, and double coverage of landline and cell users in the two sampling frames. They are also weighted to match the national demographics of gender, age, race, Hispanic ethnicity, education, region, population density, and phone status (cellphone only/landline only/both, and cellphone mostly). Demographic weighting targets are based on the most recent Current Population Survey figures for the aged 18 and older U.S. population. Phone status targets are based on the most recent National Health Interview Survey. Population density targets are based on the most recent U.S. census. All reported margins of sampling error include the computed design effects for weighting.
In addition to sampling error, question wording and practical difficulties in conducting surveys can introduce error or bias into the findings of public opinion polls.
For more details on Gallup's polling methodology, visit www.gallup.com.