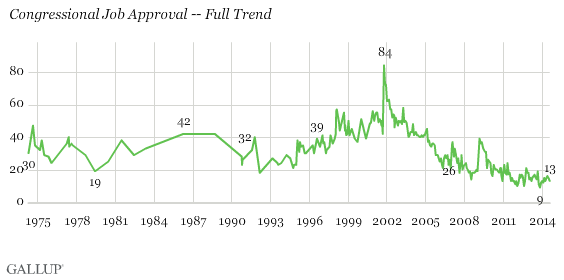
PRINCETON, NJ -- Americans' dismal evaluations of Congress continue, with 13% approving and 83% disapproving of the job it is doing. That approval rating is just four percentage points above the all-time low of 9% measured last November.
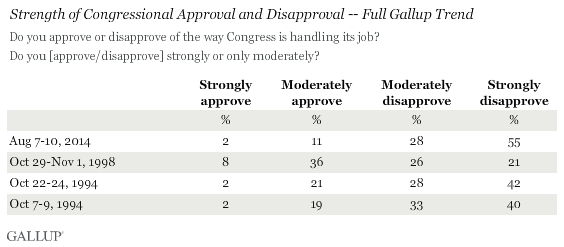
This month, Gallup followed up its standard congressional job approval question by asking Americans whether they hold that opinion strongly or only moderately. A majority, 55%, say they strongly disapprove of Congress, while 2% strongly approve.
Gallup previously asked about strength of Congress approval twice in 1994 and once in 1998. In October 1994, just before Republicans took control of Congress after 40 years as the minority party in the House of Representatives, 42% strongly disapproved of Congress.
Congress Approval on Pace to Be Lowest in Midterm Year
Since hitting the low point in Gallup's 40-year trend on congressional approval last fall -- just after the partial federal government shutdown ended -- Congress' ratings have barely improved. This year, Congress' approval has ranged between 12% and 16%, averaging 14%.
Although Congress has not had stellar approval ratings historically -- the average since 1974 is 33% -- it has never been as low in a midterm election year as it is now. The prior low at any point in a midterm election was 16% in March 2010. The lowest in the last few days before a midterm election, as voters were finalizing their vote choices, was 21%, also in 2010.
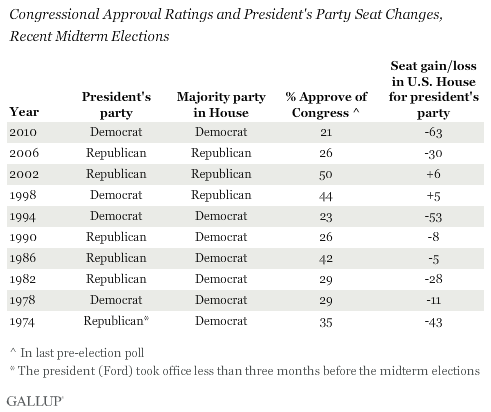
Gallup has found a strong relationship between congressional approval and seat change in Congress, with much more membership turnover when Congress' approval rating is below 40% at the time of the midterm elections. Voters typically take out their wrath more on the president's party than on the majority party in Congress (if the two differ) when Congress is unpopular, as was the case in the 1974 and 1982 elections. As a result, Democrats are probably more vulnerable than Republicans to losing seats this year. On average, the president's party has lost 34 seats in the House of Representatives when Congress' approval rating is below 40%, with a range of eight to 63 seats.
While a loss of 30 or more House seats is not out of the question this year, there are certain structural factors that may work against it. One is divided control of Congress, with Democrats currently having the majority in the Senate and Republicans in the House. That has almost certainly depressed Congress' approval ratings compared with what they would be if one party controlled both chambers. When one party controls the House and Senate, supporters of that party typically give Congress higher ratings than supporters of the other party do. In the current era of divided party control of Congress, the party gaps have disappeared. The Aug. 7-10 Gallup poll, for example, shows 14% of Republicans, 12% of independents, and 13% of Democrats approving of Congress.
A second factor working against a large seat change in the House this year is that partisan redistricting in many states has led to a situation in which fewer districts are competitive. So even if strong national forces shave five or 10 percentage points off an incumbent's usual voting percentage, that still may not be enough to tip the election to the challenger's party. And it is not clear how many more seats Republicans might be able to pick up after winning so many in 2010, and keeping most of those in the 2012 elections.
Also, perhaps because redistricting effectively limits the number of seats each party can reasonably expect to hold, since the 1960s no two-term president has had two midterm "wave elections" occur during his presidency. And Democrats' 63-seat loss in 2010 certainly qualifies as a Republican wave during the Barack Obama presidency.
Implications
Americans' dismal views of Congress are well-documented. Along with their near-historically low job approval ratings of Congress, with a majority strongly disapproving, Americans' confidence and trust in the institution, and ratings of its members as honest and ethical, are also among the lowest Gallup has measured.
That certainly makes incumbents vulnerable to defeat if they run for re-election. To date, many members of Congress have retired or decided to run for higher office, and a few others have been defeated in primary elections. This has already guaranteed that there will be some new faces in Congress. And although the vast majority of incumbents seeking re-election will win in the fall general elections, they arguably will have a more challenging run than in past years. Incumbents from more competitive districts, and those facing a strong challenger from the other party, are especially vulnerable to losing their seats this fall.
Survey Methods
Results for this Gallup poll are based on telephone interviews conducted Aug. 7-10, 2014, with a random sample of 1,032 adults, aged 18 and older, living in all 50 U.S. states and the District of Columbia.
For results based on the total sample of national adults, the margin of sampling error is ±4 percentage points at the 95% confidence level.
Interviews are conducted with respondents on landline telephones and cellular phones, with interviews conducted in Spanish for respondents who are primarily Spanish-speaking. Each sample of national adults includes a minimum quota of 50% cellphone respondents and 50% landline respondents, with additional minimum quotas by time zone within region. Landline and cellular telephone numbers are selected using random-digit-dial methods. Landline respondents are chosen at random within each household on the basis of which member had the most recent birthday.
Samples are weighted to correct for unequal selection probability, nonresponse, and double coverage of landline and cell users in the two sampling frames. They are also weighted to match the national demographics of gender, age, race, Hispanic ethnicity, education, region, population density, and phone status (cellphone only/landline only/both, and cellphone mostly). Demographic weighting targets are based on the most recent Current Population Survey figures for the aged 18 and older U.S. population. Phone status targets are based on the most recent National Health Interview Survey. Population density targets are based on the most recent U.S. census. All reported margins of sampling error include the computed design effects for weighting.
In addition to sampling error, question wording and practical difficulties in conducting surveys can introduce error or bias into the findings of public opinion polls.
View survey methodology, complete question responses, and trends.
For more details on Gallup's polling methodology, visit www.gallup.com.