Story Highlights
- Index was +3 in January, first positive month in seven years
- First positive reading for lower-income earners since recession
- Eight-point index increases for independents and Republicans
WASHINGTON, D.C. -- Gallup's U.S. Economic Confidence Index, which has been positive for each of the past six weeks, finished January with an average score of +3 -- the first time a monthly average has been in positive territory since the recession. The monthly index score is up eight points from December -- the highest month-to-month increase in more than a year.
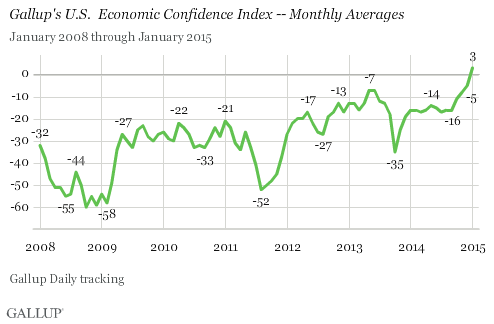
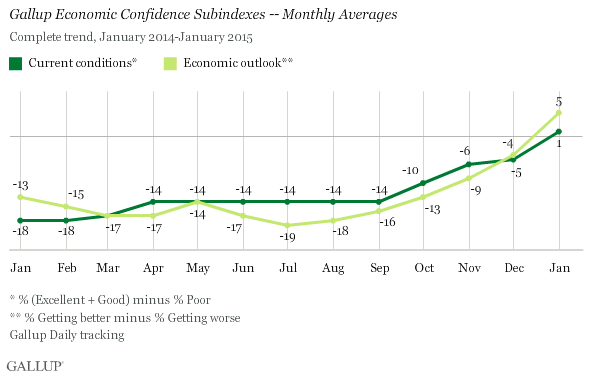
Gallup's Economic Confidence Index is the average of two components, Americans' ratings of current economic conditions and their views on whether the economy is getting better or getting worse. The index has a theoretical maximum of +100, if all Americans thought the economy was excellent or good and getting better; and a theoretical minimum of -100, if all Americans thought the economy was poor and getting worse.
The latest weekly average, for the week ending Feb. 1, is also +3, falling roughly in the middle of the index's -100 to +100 range.
For the entire month of January, 27% of Americans said the economy is "excellent" or "good," while 26% said it is "poor." This results in a current conditions score of +1, up six points from December. Meanwhile, the economic outlook score increased by nine points, reaching +5, based on 50% of Americans saying the economy is "getting better" while 45% said it is "getting worse."
Confidence Among Middle- and Lower-Income Americans Turns Positive
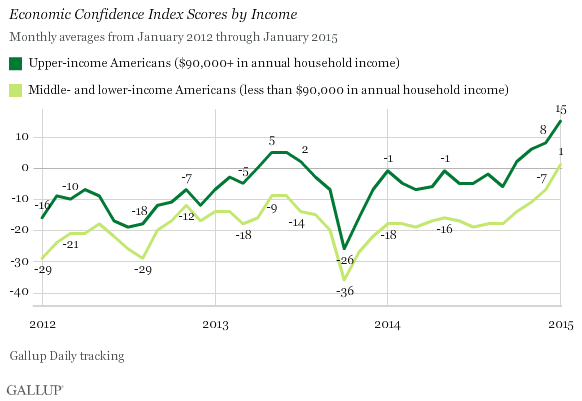
With a score of +1, middle- and lower-income Americans registered a positive reading for the first time in seven years; that score climbed eight points from December.
Upper-income Americans, whose annual household incomes are $90,000 or more a year, reached their highest level of confidence yet, at +15. This is the fourth consecutive positive monthly reading that higher-earning Americans have registered.
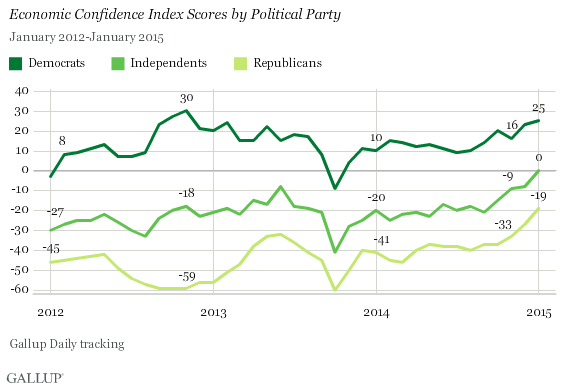
Increases in Confidence for Americans of All Political Identifications
Democrats maintain the highest level of confidence among U.S. political groups, at +25. Democrats have consistently registered positive index scores since February 2012, with the exception of October 2013 during the federal government shutdown. The current score is just short of their high of +30, measured in November 2012.
Neither independents (0) nor Republicans (-19) had index scores in positive territory last month, but both showed significant improvement from December, with scores in each group up eight points. Democrats showed a more modest two-point increase.
Bottom Line
The New Year has proved a turning point for Americans' confidence in the economy. But future monthly Economic Confidence Index readings will show whether this latest increase is a peak in confidence or a sustainable improvement that can last throughout 2015. Two economic trends have been beneficial to Americans recently: a rising stock market and lower gas prices. But low gas prices finally appear to be rising, and could imperil the January gains by putting downward pressure on economic confidence.
Survey Methods
Results for this Gallup poll are based on telephone interviews conducted Jan. 2-31, 2015, on the Gallup U.S. Daily survey, with a random sample of 14,684 adults, aged 18 and older, living in all 50 U.S. states and the District of Columbia. For results based on the total sample of national adults, the margin of sampling error is ±1 percentage point at the 95% confidence level. All reported margins of sampling error include computed design effects for weighting.
Each sample of national adults includes a minimum quota of 50% cellphone respondents and 50% landline respondents, with additional minimum quotas by time zone within region. Landline and cellular telephone numbers are selected using random-digit-dial methods.
Learn more about how the Gallup U.S. Daily works.