
Story Highlights
- Texas boasts three of top 10 metros for P2P
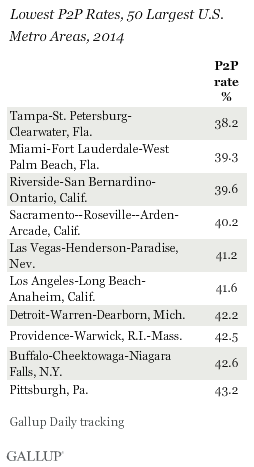
- California and Florida dominate bottom 10 metros
- Labor force participation tracks most closely with P2P
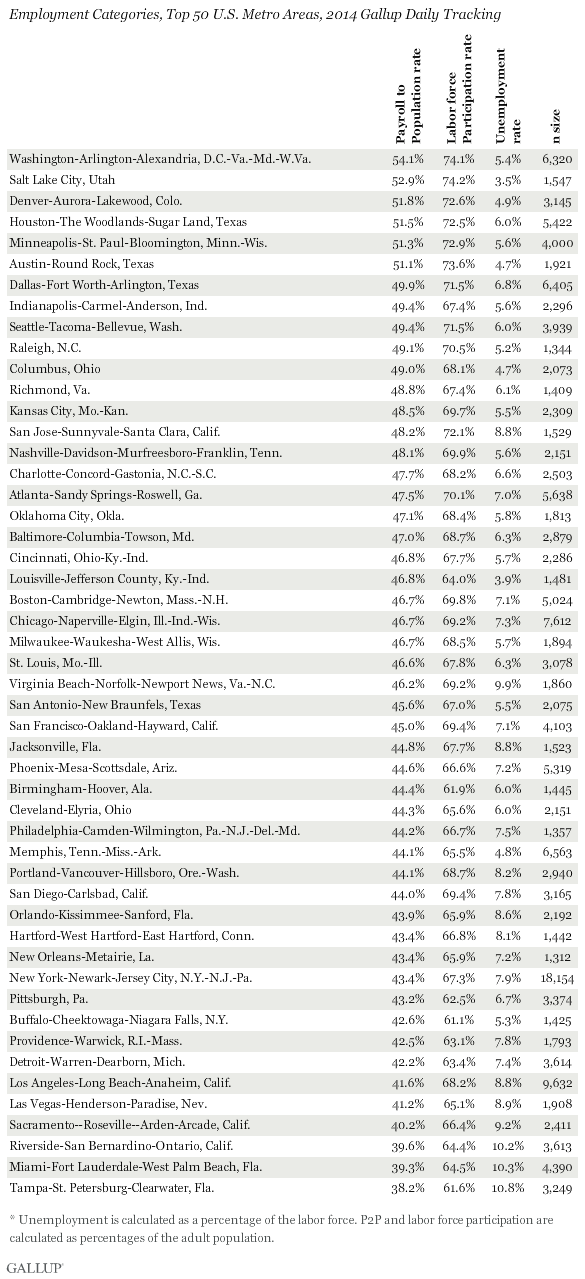
WASHINGTON, D.C. -- Washington, D.C. (54.1%) and Salt Lake City (52.9%) had the highest Payroll to Population employment rates (P2P) among the 50 largest U.S. metro areas in 2014. The rest of the top 10 metropolitan statistical areas (MSAs) in P2P were distributed widely across the country, but three were in Texas: Houston, Austin and Dallas-Fort Worth. Miami and Tampa, Florida, had the lowest P2P rates, at 38.2% and 39.3%, respectively. Three of the MSAs with the lowest P2P rates were in California: Riverside, Sacramento and Los Angeles.
|
|
|
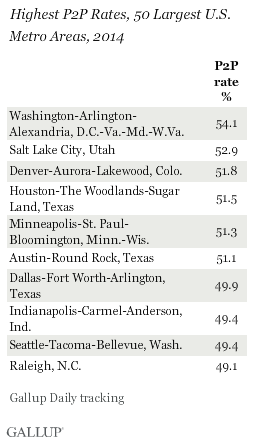
Gallup's P2P metric tracks the percentage of the adult population aged 18 and older who are employed full time for an employer for at least 30 hours per week. P2P is not seasonally adjusted. Gallup does not count adults who are self-employed, work fewer than 30 hours per week, are unemployed or are out of the workforce as payroll-employed in the P2P metric.
These results are based on Gallup Daily tracking conducted throughout 2014 in the 50 most populous U.S. metropolitan statistical areas. Gallup assigns respondents to metro areas using the definitions for MSAs developed by the federal Office of Management and Budget. Each MSA sample is weighted to ensure it is representative of the population of that metro area. Sample sizes ranged from a low of 1,312 for New Orleans, to a high of 18,154 for the New York metro area.
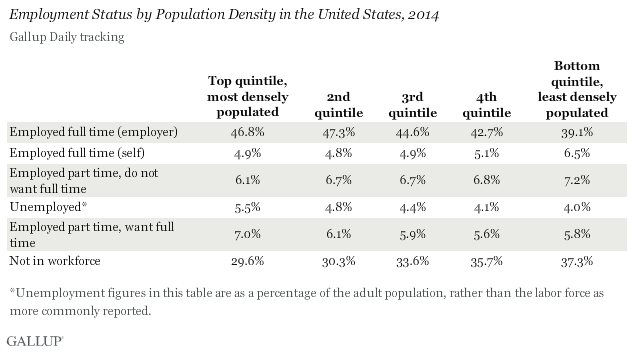
Dense urban areas tend to have higher rates of workforce participation, which drives P2P rates up as well. The average P2P rate among the 50 largest MSAs in 2014 was 46.0%, compared with the average of 44.0% for the U.S. as a whole. Nationally, the less densely populated an area is, the more likely adults are to be out of the workforce, while rates of part-time work, self-employment and unemployment remain much more consistent.
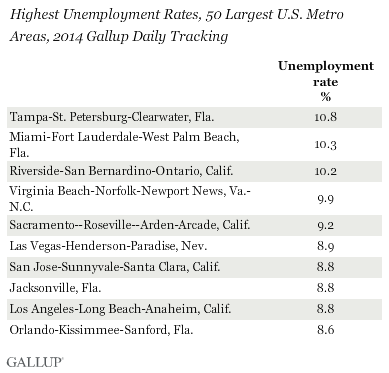
Salt Lake City Had Lowest Unemployment
As with P2P rates, MSAs in California and Florida dominate the 10 metros with the highest unemployment in 2014. Tampa registered the highest unemployment rate at 10.8%, followed by Miami at 10.3% and Riverside, California, at 10.2%. Salt Lake City had the lowest unemployment rate in 2014, at only 3.5%. The Florida MSAs, all of which are in the bottom half in P2P, are also among the highest 10 in unemployment -- suggesting their lower P2P rates are not merely a result of having a higher retired population.
While P2P reflects the proportion of adults working full time for an employer relative to the entire population, Gallup's U.S. unemployment rate reflects the proportion of adults in the workforce -- all those working or seeking work -- who are not working, but would like to be. Nationally, the U.S. averaged 6.9% unemployment in 2014. Gallup's calculation of unemployment mirrors that used by the government's Bureau of Labor Statistics (BLS) but still differs from it in several ways, including that Gallup's measure is not seasonally adjusted.
|
|
|
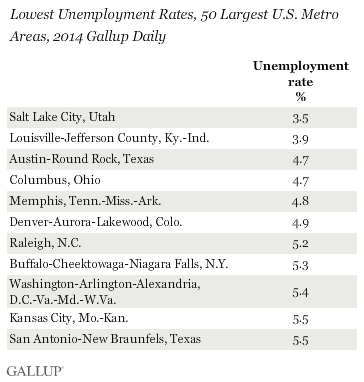
Five of the top 10 MSAs for P2P also rank in the 10 lowest MSAs for unemployment in 2014: In addition to Salt Lake City, Austin; Denver; Raleigh, North Carolina; and the District of Columbia all make the list. However, Buffalo, New York, also makes it, despite being among the bottom 10 MSAs for P2P. Buffalo ranked last among the 50 largest MSAs on workforce participation, at 61.1%, compared with 66.7% nationally.
Both P2P and unemployment are objective indicators of the employment situation, and as such, there is a great deal of overlap on these two metrics among the best- and worst-performing MSAs. The measures also correspond with the best and worst performers on Gallup's Job Creation Index and Economic Confidence Index, which provide a more attitudinal assessment of an MSA's employment and economic picture. Six of the top 10 MSAs for P2P also rank in the top 10 for economic confidence, and four rank in the top 10 for job creation. Interestingly, Detroit ranks seventh lowest in terms of P2P, but eighth highest for job creation, potentially forecasting an improvement in that employment ranking.
Implications
Comparing employment levels among the 50 largest U.S. metropolitan areas in 2014 tells a familiar story. Once again, the biggest factor countering full-time employment is not unemployment, but failure to participate in the labor force at all. According to BLS data, labor force participation declined and unemployment rose sharply in the U.S. in the wake of the 2008-2009 recession. Yet both BLS and Gallup data show that while unemployment has fallen consistently in the intervening years, labor force participation remains at historically low levels.
Higher rates of full-time employment translate not just into higher incomes, but higher well-being, too. American cities that find ways to mobilize working-age adults provide some of the best opportunities to put more Americans back into quality full-time jobs.
The data in this article are available in Gallup Analytics.
Survey Methods
Results for this Gallup poll are based on telephone interviews conducted in 2014, on the Gallup U.S. Daily survey, with a random sample of 353,732 adults, aged 18 and older, living in all 50 U.S. states and the District of Columbia. For results based on the total sample of national adults, the margin of sampling error is ±1 percentage point at the 95% confidence level.
For results based on MSA-level data, the margin of sampling error is no more than ±3 percentage points at the 95% confidence level. Respondents are assigned to metro area using OMB definitions of metropolitan statistical areas.
All reported margins of sampling error include computed design effects for weighting.
Learn more about how Gallup Daily tracking works.
