Story Highlights
- Index has mostly been negative since late February
- Index had been positive from late December to mid-February
WASHINGTON, D.C. -- Gallup's Economic Confidence Index averaged -4 in the U.S. for the week ending March 29, similar to the -3 score the week prior. The index has been slightly negative in five out of the past six weeks after an eight-week positive string that started in late December.
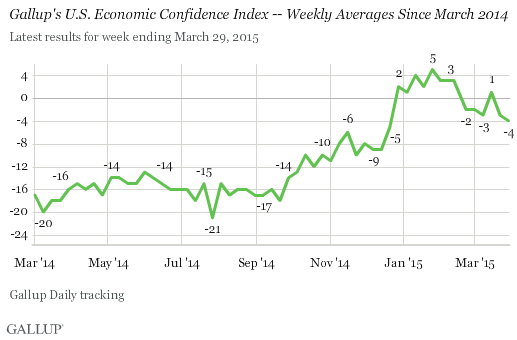
The Economic Confidence Index began to rise late in 2014, likely related to falling gas prices, and crossed into positive territory in late December for the first time since the recession. The index peaked at +5 for the week ending Jan. 25, but confidence has dipped since, falling back below the zero midpoint of the scale for all but one week since late February.
Gallup's Economic Confidence Index is the average of two components: Americans' views of the state of the current economy and their opinions on whether the economy is getting better or worse. The theoretical maximum of the index is +100, if all Americans say the economy is excellent or good and getting better. The theoretical minimum is -100, if all Americans believe the economy is poor and getting worse.
For the week ending March 29, 27% of Americans said the current economy was excellent or good, while 28% said it was poor. This resulted in a current conditions score of -1, level with the week prior.
Americans are a bit more pessimistic about the economy's direction than its current state. The latest weekly economic outlook score is -6, based on 44% of Americans saying the economy is getting better versus 50% saying it is getting worse. That is essentially the same as the -5 outlook score for the week before.
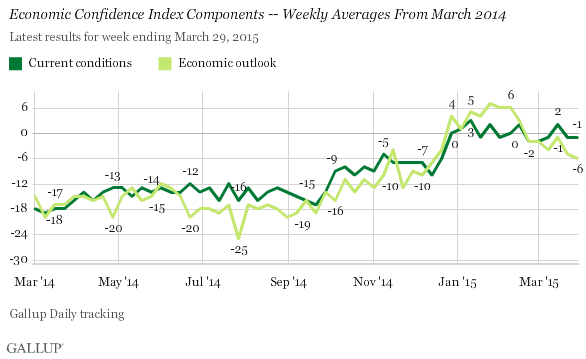
Between late December and late February, Americans were generally more optimistic than they are currently about the outlook for the economy, which helped push the Economic Confidence Index as a whole into positive territory. Since the end of February, economic outlook scores have generally been lower than Americans' ratings of current economic conditions, which has pushed the index back into negative territory.
In the first three months of 2015, current conditions scores have been fairly flat, staying between -2 and +3. Economic outlook scores have varied more, ranging from -6 to +7 between the last full week of December and the last full week of March.
The data in this article are available in Gallup Analytics.
Survey Methods
Results for this Gallup poll are based on telephone interviews conducted March 23-29, 2015, on the Gallup U.S. Daily survey, with a random sample of 3,544 adults, aged 18 and older, living in all 50 U.S. states and the District of Columbia. For results based on the total sample of national adults, the margin of sampling error is ±2 percentage points at the 95% confidence level. All reported margins of sampling error include computed design effects for weighting.
Each sample of national adults includes a minimum quota of 50% cellphone respondents and 50% landline respondents, with additional minimum quotas by time zone within region. Landline and cellular telephone numbers are selected using random-digit-dial methods.
Learn more about how Gallup Daily tracking works.