Story Highlights
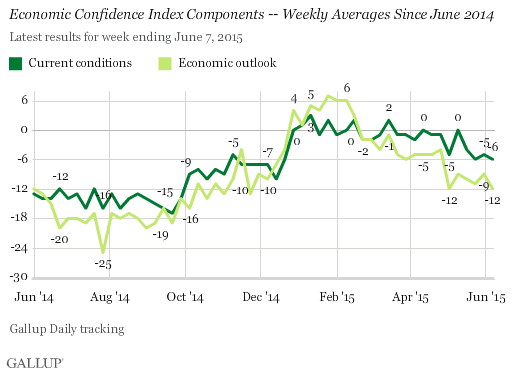
- Current conditions score at -6
- Economic outlook score down, at -12
WASHINGTON, D.C. -- Gallup's U.S. Economic Confidence Index registered at -9 for the week ending June 7, the sixth straight week the index has been at or below -5.
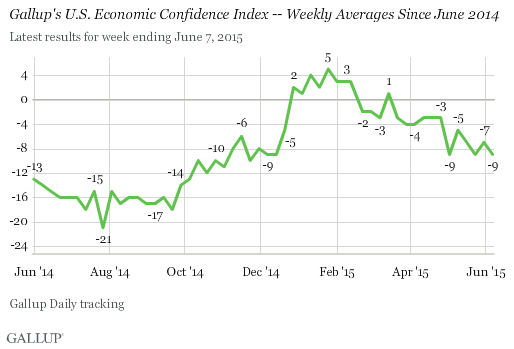
After climbing steadily during the fall of last year and registering positive scores from late December through mid-February, the U.S. Economic Confidence Index slipped to between -3 and -4 for most of March and April in Gallup's weekly averages. The index dipped more at the start of May, reaching -9, and has remained near that level since.
Still, on a relative basis the recent weekly index readings are much higher than Gallup found for most weeks between January 2008 and November 2014, when the index ranged from -65 to -3.
Gallup's Economic Confidence Index is the average of two components: Americans' views of current economic conditions and their perceptions of whether the U.S. economy is getting better or getting worse. The theoretical maximum for the index is +100, if all Americans say the economy is excellent or good and getting better. The theoretical minimum is -100, if all Americans say the economy is poor and getting worse.
For the week ending June 7, 24% of Americans said the economy is excellent or good while 30% said it is poor, resulting in a current conditions score of -6. The economic outlook score of -12, the lowest score for this component since early May, is the result of 42% of Americans saying the economy is getting better and 54% saying it is getting worse.
Bottom Line
Americans' outlook has improved on a variety of economic measures, but their overall confidence in the U.S. economy is registering significantly lower values in the past several weeks than it did from late December to late April.
The recent erosion in confidence may be related to rising gas prices since the beginning of the year. The direction of gas prices in the months ahead could help predict the trajectory of economic confidence, as could other economic information consumers are likely to pick up on, including the monthly government jobs report -- which for May was stronger than some analysts expected.
The data in this article are available in Gallup Analytics.
Survey Methods
Results for this Gallup poll are based on telephone interviews conducted June 1-7, 2015, on the Gallup U.S. Daily survey, with a random sample of 3,035 adults, aged 18 and older, living in all 50 U.S. states and the District of Columbia. For results based on the total sample of national adults, the margin of sampling error is ±2 percentage points at the 95% confidence level. All reported margins of sampling error include computed design effects for weighting.
Each sample of national adults includes a minimum quota of 50% cellphone respondents and 50% landline respondents, with additional minimum quotas by time zone within region. Landline and cellular telephone numbers are selected using random-digit-dial methods.
Learn more about how Gallup Daily tracking works.