Story Highlights
- Economic Confidence Index at -9, similar to previous seven weeks
- Current conditions score remains higher than economic outlook
WASHINGTON, D.C. -- Gallup's Economic Confidence Index averaged -9 for the week ending June 21. This is in line with the narrow range of index scores between -5 and -9 since early May.
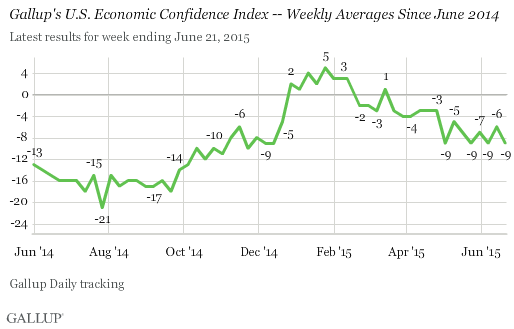
The index entered positive territory in late 2014 and early 2015 for the first time since Daily tracking began in 2008. It has since gone through three distinct periods. The first -- the initial seven weeks of the year -- was marked by positive averages between +1 and +5. This was followed by a period beginning in late February when the index averaged between -4 and +1. The index average fell to -9 at the start of May and has registered -5 or lower since.
Prior Gallup research indicates that dropping gas prices may be related to the index's entering positive territory early this year, and that the subsequent fall in the index may be related to rising gas prices. While the Economic Confidence Index is lower for the week ending June 21 than it was earlier in 2015, its current average remains among the highest Gallup has found since 2008.
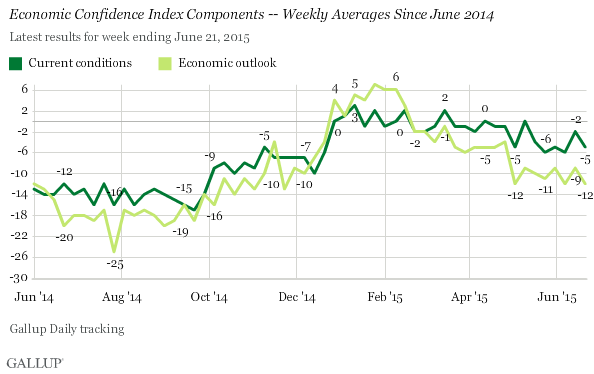
Gallup's Economic Confidence Index is the average of two components: how Americans rate the current economy and whether they feel the economy is getting better or worse. Americans' outlook for the economy remains more negative than their ratings of the current economy, as has been the case since early March.
For the week ending June 21, 25% of Americans said the economy is "excellent" or "good," while 30% said it is "poor." This resulted in a current conditions average of -5. The economic outlook measure averaged -12, the result of 42% of Americans saying the economy is "getting better" while 54% said it is "getting worse."
These data are available in Gallup Analytics.
Survey Methods
Results for this Gallup poll are based on telephone interviews conducted June 15-21, 2015, on the Gallup U.S. Daily survey, with a random sample of 3,549 adults, aged 18 and older, living in all 50 U.S. states and the District of Columbia. For results based on the total sample of national adults, the margin of sampling error is ±2 percentage points at the 95% confidence level. All reported margins of sampling error include computed design effects for weighting.
Each sample of national adults includes a minimum quota of 50% cellphone respondents and 50% landline respondents, with additional minimum quotas by time zone within region. Landline and cellular telephone numbers are selected using random-digit-dial methods.
Learn more about how Gallup Daily tracking works.