Story Highlights
- October 2015 rate almost full point higher year on year
- Unemployment lowest Gallup has measured since January 2010
- Fewer unemployed or out of the workforce, more working part time
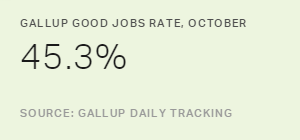
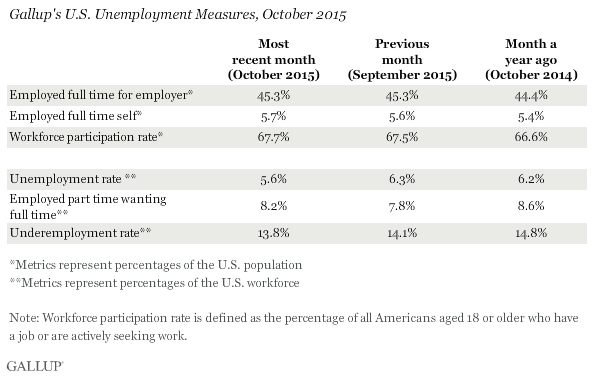
WASHINGTON, D.C. -- The Gallup Good Jobs rate (GGJ) in the U.S. was 45.3% in October. This is even with the rate measured for the past two months, and the highest Gallup has measured for any October since 2012, when the rate was at its 2010-2015 peak of 45.7%.
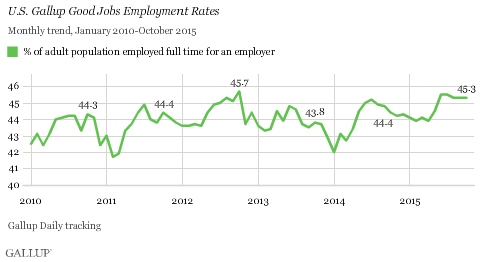
Gallup's GGJ metric -- previously labeled "Payroll to Population" or "P2P" -- tracks the percentage of the U.S. adult population, aged 18 and older, who work for an employer for at least 30 hours per week. GGJ is not seasonally adjusted. The latest results are based on Gallup Daily tracking interviews with 30,422 Americans, conducted Oct. 1-31 by landline telephone and cellphone. Gallup does not count adults who are self-employed, work fewer than 30 hours per week, are unemployed or are out of the workforce as payroll-employed in the GGJ metric.
Workforce Participation at 67.7% in October
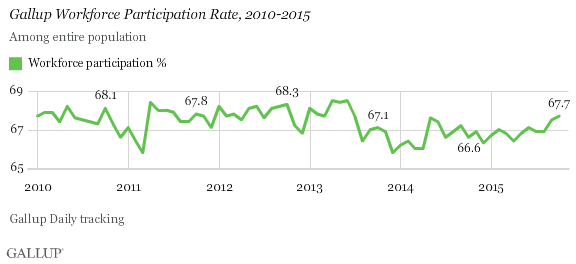
The percentage of U.S. adults participating in the workforce in October was 67.7%. This was up only slightly from the rate measured in September (67.5%) and in October of last year (66.6%). Gallup's workforce participation measure averaged 67.7% between January 2010 and June 2013, but since then has averaged 66.8%. Higher participation rates in the past several months may signal returning strength in the labor market. Gallup defines workforce participation as the percentage of adults, aged 18 and older, who are working or who are not working but are actively looking for work and are available for employment.
Workforce participation increased by 0.6 percentage points from August to September 2015, coinciding with Gallup's decision to include more cellphone interviews in the U.S. beginning Sept. 1. It is not clear to what extent the changes in the sample are influencing changes in workforce participation seen since August. Changes in the sample could increase the number of employed people in Gallup's samples.
Unemployment Falls to 5.6%
Gallup's unadjusted U.S. unemployment rate was 5.6% in October, down from September's 6.3% and the lowest Gallup has measured since tracking began in January 2010. The previous record low for unemployment was set in December 2014, at 5.8%. Gallup's U.S. unemployment rate represents the percentage of adults in the workforce who did not have any paid work in the past seven days, for an employer or themselves, and who were actively looking for and available to work.
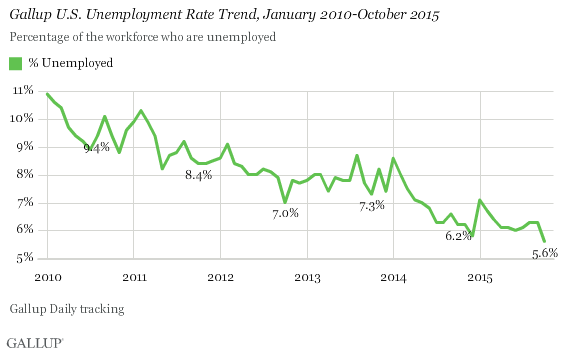
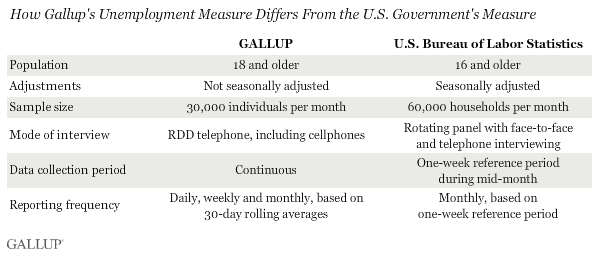
Unlike Gallup's GGJ rate, which is a percentage of the total population, the unemployment rates that Gallup and the U.S. Bureau of Labor Statistics report are percentages of the labor force. While both Gallup and BLS data are based on surveys with large sample sizes, the two have important methodological differences -- outlined at the end of this article. Additionally, the most discussed unemployment rate released by the BLS each month is seasonally adjusted, while Gallup reports unadjusted numbers. Although Gallup's employment numbers strongly correlate with BLS rates, the BLS and Gallup estimates of unemployment do not always track precisely on a monthly basis.
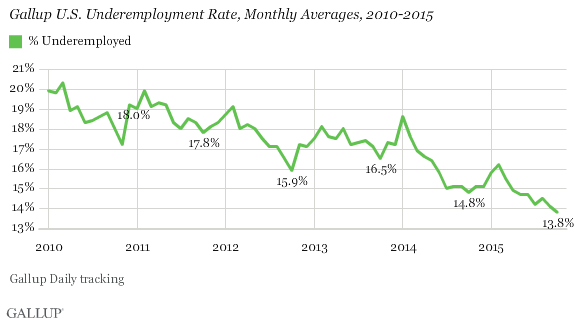
Underemployment Down at 13.8%
Gallup's measure of underemployment in October is 13.8%, down 0.3 points from September. This rate is lower than in any month since Gallup began tracking it daily in 2010. Gallup's U.S. underemployment rate combines the percentage of adults in the workforce who are unemployed (5.6%) with those who are working part time but desire full-time work (8.2%). While unemployment fell in October, the rate of "involuntary part-time" work rose 0.4 points from the 7.8% measured in September.
Bottom Line
The full-time payroll employment rate, otherwise known as the Gallup Good Jobs rate, was steady in October, where in most years it has risen from the rate in September. However, with workforce participation up, unemployment down and GGJ near its peak in Gallup's five-year trend, the overall employment picture is more positive than this headline figure might suggest.
Unemployment has steadily fallen over the past five years, but workforce participation has consistently lagged behind, keeping the labor market soft and full-time employment stagnant. If workforce participation continues to strengthen, pressure may build in the economy to move more of the involuntary part-time workers into more secure, higher paying full-time employment.
The data in this article are available in Gallup Analytics.
Gallup.com reports results from these indexes in daily, weekly, and monthly averages and in Gallup.com stories. Complete trend data are always available to view and export in the following charts:
Daily: Employment, Economic Confidence and Job Creation, Consumer Spending
Weekly: Employment, Economic Confidence, Job Creation, Consumer Spending
Read more about Gallup's economic measures.
View our economic release schedule.
Survey Methods
Results for this Gallup poll are based on telephone interviews conducted Oct. 1-31, 2015, on the Gallup U.S. Daily survey, with a random sample of 30,422 adults, aged 18 and older, living in all 50 U.S. states and the District of Columbia. For results based on the total sample of national adults, the margin of sampling error is ±1 percentage point at the 95% confidence level. All reported margins of sampling error include computed design effects for weighting.
Each sample of national adults includes a minimum quota of 60% cellphone respondents and 40% landline respondents, with additional minimum quotas by time zone within region. Landline and cellular telephone numbers are selected using random-digit-dial methods.
Learn more about how Gallup Daily tracking works.
